| Netra 240 Server Service Manual
|
   
|
Identifying the Netra 240 Server Components and LEDs
|
This chapter contains the following sections:
|
Note - Illustrations may contain optional components that are not available on all standard configurations of the Netra 240 server.
|
Identifying the Netra 240 Server Components
The components for the Netra 240 server can be broken down into three areas:
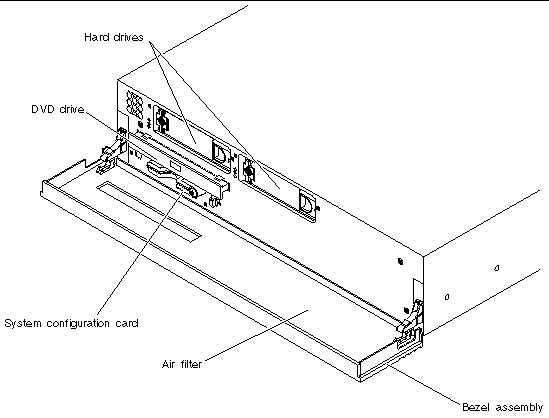
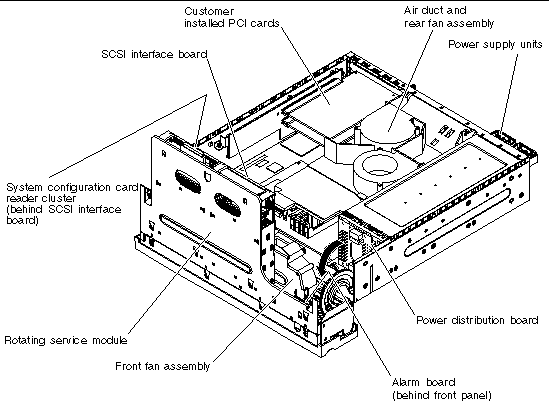
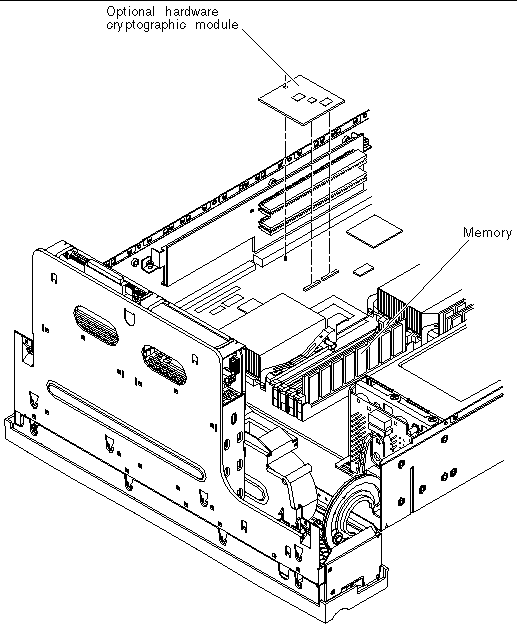
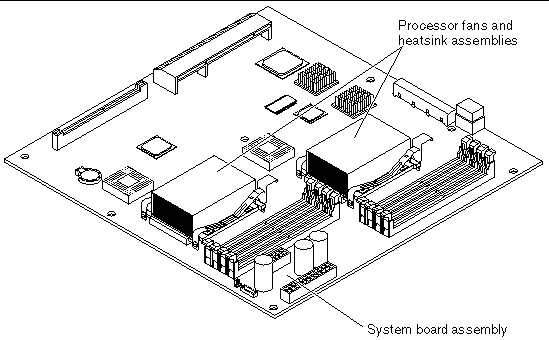
Refer to TABLE 1-1 for more information on identifying the Netra 240 server components and where the service instructions are located in this document.
FIGURE 1-1 Front Panel Components

FIGURE 1-2 Rotating Service Module - Miscellaneous Internal Components and Rear Panel Components

FIGURE 1-3 Hardware Cryptographic Module and Memory

FIGURE 1-4 Processor Fans and Heat Sink Assemblies on a Replacement System Board

|
Note - The Netra 240 server comes installed with heat sink assemblies, and no processor fans, on the system board(s). However, processor fans and heat sink assemblies are present on a field-replaceable system board assembly. See Appendix A for system board FRU part numbers and Installing a System Board for instructions on removing the processor fans during system board installation.
|
Optional Components
TABLE 1-2 lists the order numbers of the optional server components, and TABLE 1-3 lists the order numbers of the optional PCI cards.
|
Note - The list of optional components might be updated at any time. Refer to the Sun StoreSM web site (http://store.sun.com) for the most current list of Netra 240 server supported components.
|
TABLE 1-2 Optional Components
|
Component
|
Description
|
Order Number
|
|
Storage disk
(Maximum 2 disks per server)
|
73 GB 15K RPM 1-inch SCSI hard drive
|
XRA-SC1N2-73G15K
|
|
Memory
(Multiple of 2 DIMMs, and a Maximum of 4 DIMMs per CPU)
|
512 MB memory expansion (2 x 256 MB DIMMs)
|
X7402A
|
|
1 GB memory expansion (2 x 512 MB DIMMs)
|
X7403A
|
|
2 GB memory expansion (2 x 1 GB DIMMs)
|
X7404A
|
|
|
512 MB memory expansion (2 x 256 MB SPD 1.0 DIMMs)
|
X7602A
|
|
|
1 GB memory expansion (2 x 512 MB SPD 1.0 DIMMs)
|
X7603A
|
|
|
2 GB memory expansion (2 x 1 GB SPD 1.0 DIMMs)
|
X7604A
|
|
Sun Crypto Accelerator 500 card
|
Sun Crypto Accelerator 500
|
X7405A
|
|
Removable media
|
Internal slim DVD-ROM drive
|
X7425A
|
|
|
Internal slim DVD-RW drive
|
X7413A
|
|
Rackmount kits
|
19-inch 2-post rackmount kit
|
X7901A
|
|
23-inch 2-post rackmount kit
|
X7902A
|
|
600mm x 600mm rackmount kit
|
X7904A
|
|
19-inch 4-post slide mount kit
|
X8099A
|
|
Processor upgrade kit
|
1.28 GHz processor kit
|
X7412A
|
|
Air filter pack
|
Air filter pack containing 10 foam filters
|
X8216A
|
TABLE 1-3 Supported PCI Cards
|
Order Number
|
Description
|
Maximum Number Supported
|
|
X1150A
|
Sun GigaSwift Ethernet UTP
|
2
|
|
X1151A
|
Sun GigaSwift Ethernet MMF
|
2
|
|
X1155A
|
High Speed Serial Interface PCI (HSI/P) 2.0
|
1
|
|
X2156A
|
Serial Asynchronous Interface PCI (SAI/P) adapter 3.0
|
2
|
|
X2222A
|
Dual Ultra-2 SCSI/Dual FastEthernet PCI
|
1
|
|
X4011A
|
Crypto Accelerator 4000 UTP (copper)
|
1
|
|
X6541A
|
Dual Differential Ultra/Wide SCSI (UDWIS/P)
|
2
|
|
X6758A
|
PCI Dual Channel Ultra3 SCSI host adapter
|
2
|
|
X6799A
|
PCI Single FC-AL Host adapter
Note: This adapter has been qualified, but not NEBS tested.
|
1
|
Identifying the Netra 240 Server LED Indicators
The server has LED indicators associated with the server itself and with various components. The server status indicators are located on the bezel and are repeated on the back panel. The components with LED indicators to convey status are the dry contact alarm card, power supply units, Ethernet port, and hard drives. Details on the network link indicators and the network speed indicators are also provided.
Front Panel Indicators
TABLE 1-4 to TABLE 1-6 provide details about the indicators on the front panel and a description of the dry contact alarm states of the Netra 240 server. See FIGURE 1-5 and FIGURE 1-6 for the location of the front panel indicators.
FIGURE 1-5 Location of the Front Panel Indicators

TABLE 1-4 Server Status Indicators (Front and Rear Panels)
|
Indicator
|
LED Color
|
LED State
|
Meaning
|
|
Activity
|
Green
|
On
|
The server is powered up and running the Solaris Operating System (Solaris OS). Operating System (Solaris OS).
|
|
|
|
Off
|
Either power is not present or Solaris software is not running.
|
|
Service Required
|
Yellow
|
On
|
The server has detected a problem and requires the attention of service personnel.
|
|
|
|
Off
|
The server has no detected faults.
|
|
Locator
|
White
|
On
|
A continuous light turns on and identifies the server from others in a rack, when the ALOM setlocator command is used.
|
TABLE 1-5 Alarm Indicators and Dry Contact Alarm States
|
Indicator and Relay
Labels
|
Indicator Color
|
Application or Server State
|
Condition or Action
|
System Indicator State
|
Alarm Indicator State
|
Relay
NC
State
|
Relay
NO
State
|
Comments
|
|
Critical
(Alarm0)
|
Red
|
Server state (Power on/off and
Solaris OS functional/
not functional)
|
No power input
|
Off
|
Off
|
Closed
|
Open
|
Default state
|
|
System power off
|
Off
|
Off
|
Closed
|
Open
|
Input power connected
|
|
System power turns on; Solaris OS not fully loaded
|
Off
|
Offiii
|
Closed
|
Open
|
Transient state
|
|
Solaris OS successfully loaded
|
On
|
Off
|
Open
|
Closed
|
Normal operating state
|
|
Watchdog timeout
|
Off
|
On
|
Closed
|
Open
|
Transient state, reboot Solaris OS
|
|
Solaris OS shutdown initiated by user
|
Off
|
Offiii
|
Closed
|
Open
|
Transient state
|
|
Lost input power
|
Off
|
Off
|
Closed
|
Open
|
Default state
|
|
System power shutdown by user
|
Off
|
Offiii
|
Closed
|
Open
|
Transient state
|
|
Application state
|
User sets Critical alarm on
|
--
|
On
|
Closed
|
Open
|
Critical fault detected
|
|
User sets Critical alarm offii
|
--
|
Off
|
Open
|
Closed
|
Critical fault cleared
|
|
Major
(Alarm1)
|
Red
|
Application state
|
User sets Major alarm onii
|
--
|
On
|
Open
|
Closed
|
Major fault detected
|
|
User sets Major alarm offii
|
--
|
Off
|
Closed
|
Open
|
Major fault cleared
|
|
Minor
(Alarm2)
|
Amber
|
Application state
|
User sets Minor alarm onii
|
--
|
On
|
Open
|
Closed
|
Minor fault detected
|
|
User sets Minor alarm offii
|
--
|
Off
|
Closed
|
Open
|
Minor fault cleared
|
|
User
(Alarm3)
|
Amber
|
Application state
|
User sets User alarm onii
|
--
|
On
|
Open
|
Closed
|
User fault detected
|
|
User sets User alarm offii
|
--
|
Off
|
Closed
|
Open
|
User fault cleared
|
In all cases when the user sets an alarm, a message is displayed on the console. For example, when the critical alarm is set, the following message is displayed on the console:
Note that in some instances when the critical alarm is set, the associated alarm indicator is not lit. This implementation is subject to change in future
(see Footnote iii of TABLE 1-5).
SC Alert: CRITICAL ALARM is set
|
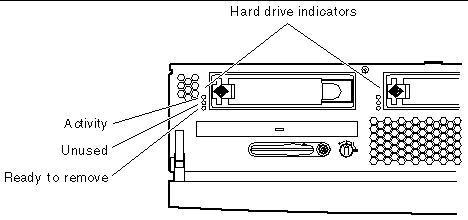
FIGURE 1-6 Hard Drive Indicators

TABLE 1-6 Hard Drive Indicators
|
Indicator
|
LED Color
|
LED State
|
Component Status
|
|
Activity
|
Green
|
Flashing
|
Active SCSI transactions.
|
|
|
Off
|
No activity.
|
|
Unused
|
|
|
Reserved for future use.
|
|
Ready to remove
|
Blue
|
On
|
Ready to remove.
|
|
|
|
Off
|
Not ready to remove.
|
Rear Panel Indicators
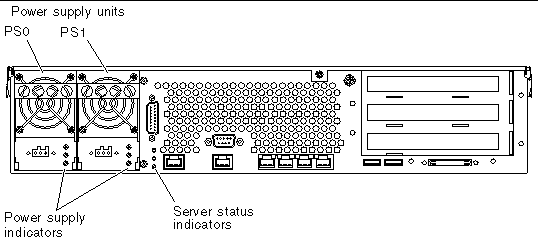
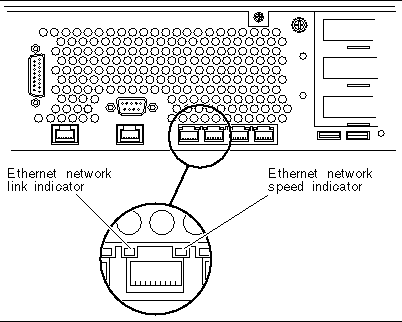
TABLE 1-7 to TABLE 1-9 below provide details about the indicators on the rear panel of the Netra 240 server. See FIGURE 1-7 and FIGURE 1-8 for the location of the rear panel indicators.
FIGURE 1-7 Rear Panel Indicators

FIGURE 1-8 Ethernet Network Indicators

TABLE 1-7 Network Link Indicators
|
LED Color
|
LED State
|
Network Link Status
|
|
Green
|
On
|
Link is established.
|
|
|
Blinking
|
Link is transferring data.
|
|
|
Off
|
Link is not established.
|
For a summary of what the network speed indicators mean, see TABLE 1-8.
TABLE 1-8 Network Speed Indicators
|
LED Color
|
LED State
|
Network Speed Status
|
|
Green
|
On
|
The network link is established and running at its maximum supported speed.
|
|
|
Off
|
- If the network activity indicator is on, the network link is established but not running at its maximum supported speed.
- If the network activity indicator is off, the network link is not established.
|
TABLE 1-9 Power Supply Unit Indicators
|
LED Color
|
LED State
|
Component Status
|
|
Green
|
On
|
Power is present and the PSU is active.
|
|
|
Off
|
Either power is not present, or the PSU has shut down due to an internal protection event.
|
|
Amber
|
On
|
The power supply unit has shut down due to an internal protection event and requires service attention.
|
|
|
Off
|
The power supply unit is operating normally.
|
|
Blue
|
On
|
The power supply unit is ready to be removed.
|
|
|
Off
|
The power supply unit is not ready for removal.
|
