| Oracle® Database 2 Day + Data Replication and Integration Guide 11g Release 1 (11.1) Part Number B28324-01 |
|
|
View PDF |
| Oracle® Database 2 Day + Data Replication and Integration Guide 11g Release 1 (11.1) Part Number B28324-01 |
|
|
View PDF |
This chapter describes how to manage, monitor, and troubleshoot an Oracle Streams replication environment.
This chapter contains the following sections:
See Also:
An Oracle Streams replication environment should not require much management. If the environment is configured properly, then it should replicate changes to database objects automatically with minimal administration required. This section contains instructions for performing administrative tasks that might be required from time to time in an Oracle Streams replication environment.
The following topics describe managing an Oracle Streams replication environment:
See Also:
You can use Enterprise Manager to manage capture processes. This topic includes instructions for completing the most common management tasks for capture processes.
The following topics describe managing capture processes:
This topic contains instructions for starting and stopping a capture process in Enterprise Manager.
A capture process might stop automatically if it encounters an error, such as an unsupported data type. When this happens, the error is displayed on the Capture subpage of the Streams page in Enterprise Manager. In this case, you should correct the error and restart the capture process.
Also, it is important to remember that a capture process can capture changes that were made to database objects while the capture process was stopped. These changes are recorded in the redo log, and a capture process finds the changes that it is configured to capture in the redo log after it restarts. If you want to avoid capturing specific changes to database objects, then you should use tags to accomplish this. See "About Tags for Avoiding Change Cycling".
To start or stop a capture process:
In Oracle Enterprise Manager, log in to the database as the Oracle Streams administrator.
Go to the Database Home page.
Click Data Movement to open the Data Movement subpage.
Click Manage in the Streams section.
The Streams page appears, showing the Overview subpage.
Click Capture to open the Capture subpage.

Select the capture process that you want to start or stop.
Click Start to start a disabled or aborted capture process, or click Stop to stop an enabled capture process.
Click Yes on the confirmation page to finish starting or stopping the capture process.
This topic contains instructions for setting capture process parameters in Enterprise Manager. Capture process parameters control the way a capture process operates. You can set a parameter to change a specific way in which a capture process operates. For example, you can change the parallelism capture process parameter to control the number of processes that capture changes. Typically, you adjust capture process parallelism to achieve the best capture process performance.
To set a capture process parameter:
In Oracle Enterprise Manager, log in to the database as the Oracle Streams administrator.
Go to the Database Home page.
Click Data Movement to open the Data Movement subpage.
Click Manage in the Streams section.
The Streams page appears, showing the Overview subpage.
Click Capture to open the Capture subpage.

Select the capture process that you want to modify.
Click Edit to open the Edit Capture page.
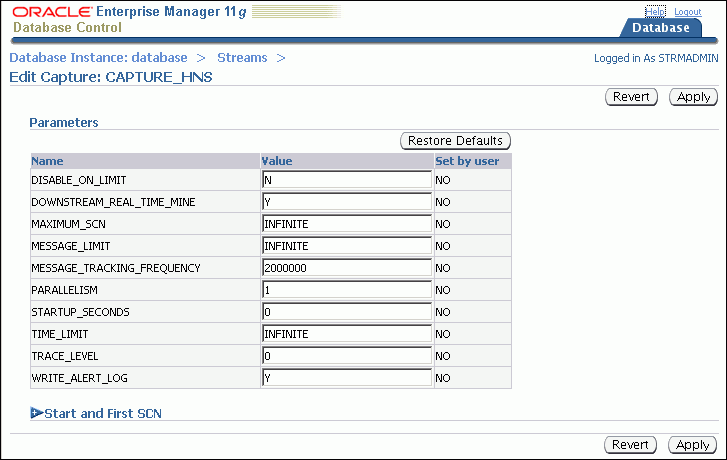
Modify one or more capture process parameters in the Parameters section.
See Oracle Database PL/SQL Packages and Types Reference for information about the parameters. If you change the parallelism parameter, then the capture process automatically stops and restarts when you click Apply.
Click Apply to save your changes.
This topic contains instructions for enabling or disabling a propagation in Enterprise Manager.
You might need to disable a propagation if the database to which the propagation sends messages goes down or if a network problem prevents the propagation from sending messages. In these situations, you can disable the propagation and enable it when the problem is corrected.
Also, a propagation becomes disabled automatically after it fails to send messages in 16 consecutive attempts. When this happens, the error is displayed on the Propagation subpage of the Streams page in Enterprise Manager. In this case, you should correct the error and enable the propagation.
To enable or disable a propagation:
In Oracle Enterprise Manager, log in to the database as the Oracle Streams administrator.
Go to the Database Home page.
Click Data Movement to open the Data Movement subpage.
Click Manage in the Streams section.
The Streams page appears, showing the Overview subpage.
Click Propagation to open the Propagation subpage.
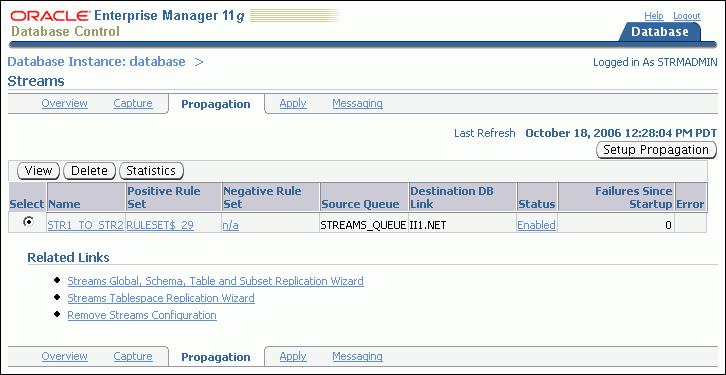
Click the link in the Status field of the propagation that you want to enable or disable. The link text is either Enabled or Disabled.
The Status page for the propagation appears.
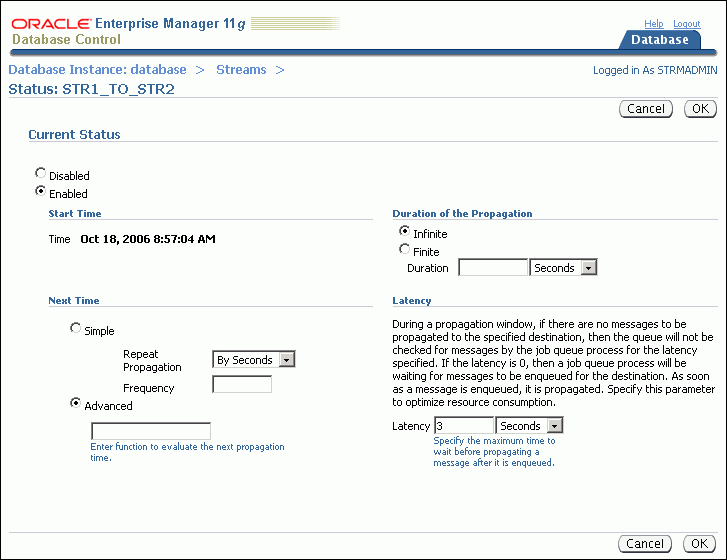
Change the status to either Enabled or Disabled in the Current Status section.
Do not modify the settings under any of the following sections: Next Time, Duration of Propagation, or Latency. Generally, the default values in these sections provide the most efficient propagation. Modifying the propagation schedule is outside the scope of this guide.
Click OK to save your changes.
See Also:
Oracle Streams Advanced Queuing User's Guide for more information about managing propagations and propagation schedules
You can use Enterprise Manager to manage apply processes. This section includes instructions for completing the most common management tasks for apply processes.
The following topics describe managing apply processes:
This topic contains instructions for starting and stopping an apply process in Enterprise Manager.
An apply process might stop automatically if it encounters an error, such as attempting to update a row that does not exist in a table. When this happens, the status of the apply process is ABORTED on the Apply subpage of the Streams page in Enterprise Manager. In this case, you should correct the error and restart the apply process.
To start or stop an apply process:
In Oracle Enterprise Manager, log in to the database as the Oracle Streams administrator.
Go to the Database Home page.
Click Data Movement to open the Data Movement subpage.
Click Manage in the Streams section.
The Streams page appears, showing the Overview subpage.
Click Apply to open the Apply subpage.

Select the apply process that you want to start or stop.
Click Start to start a disabled or aborted apply process, or click Stop to stop an enabled apply process.
Click Yes on the confirmation page to finish starting or stopping the apply process.
This topic contains instructions for setting apply process parameters in Enterprise Manager. Apply process parameters control the way an apply process operates. You can set a parameter to change a specific way in which an apply process operates. For example, you can change the parallelism apply process parameter to control the number of processes that apply changes. Typically, you adjust apply process parallelism to achieve the best apply process performance.
To set an apply process parameter:
In Oracle Enterprise Manager, log in to the database as the Oracle Streams administrator.
Go to the Database Home page.
Click Data Movement to open the Data Movement subpage.
Click Manage in the Streams section.
The Streams page appears, showing the Overview subpage.
Click Apply to open the Apply subpage.

Select the apply process that you want to modify.
Click Edit to open the Edit Apply page.
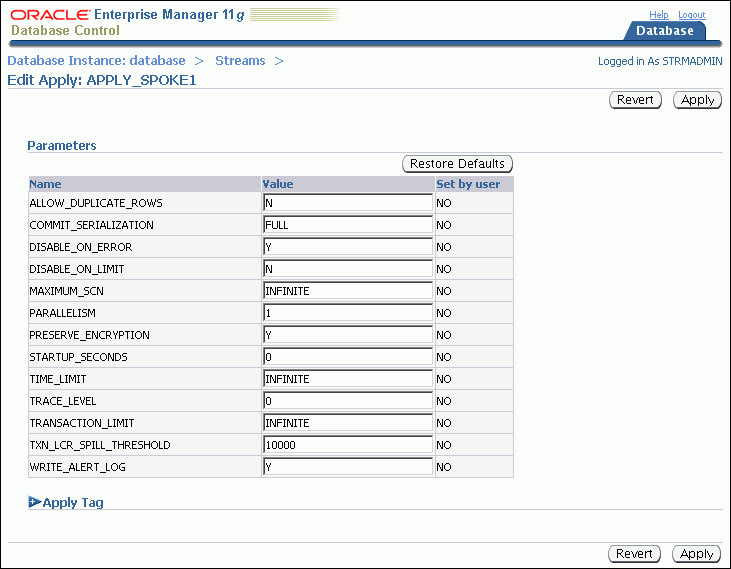
Modify one or more apply process parameters in the Parameters section.
See Oracle Database PL/SQL Packages and Types Reference for information about the parameters. If you change the parallelism parameter, then the apply process automatically stops and restarts when you click Apply.
Click Apply to save your changes.
This section describes using Enterprise Manager and SQL*Plus to display general information about replication components and the replication topology. It also contains instructions for monitoring capture processes, propagations, and apply processes.
The following topics describe monitoring an Oracle Streams replication environment:
Displaying an Overview of the Replication Components at a Database
Displaying the Topology of the Oracle Streams Replication Environment at a Database
See Also:
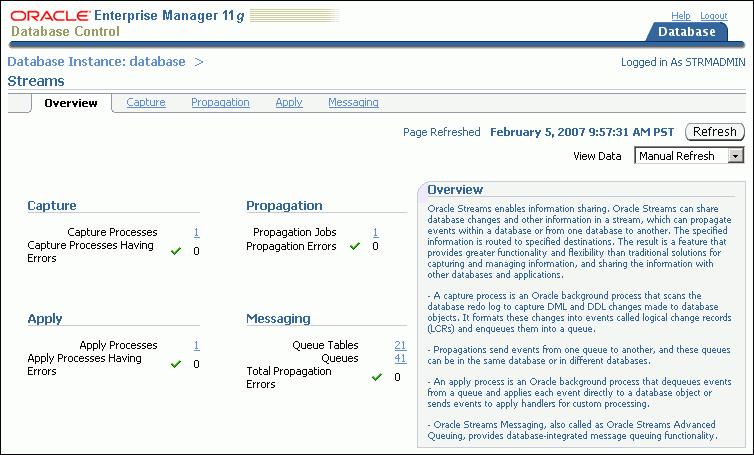
The Overview subpage of the Streams page in Enterprise Manager contains information about the Oracle Streams components in the current database. This information includes:
The number of capture processes, propagations, apply processes, queues, and queue tables in the local database.
The number of capture processes, propagations, and apply processes that currently have errors.
You can click a number to drill down to more information about a component or to manage a component.
To display an overview of the replication components at a database:
In Oracle Enterprise Manager, log in to the database as the Oracle Streams administrator.
Go to the Database Home page.
Click Data Movement to open the Data Movement subpage.
Click Manage in the Streams section.
The Streams page appears, showing the Overview subpage. Click Help for more information about the Oracle Streams Overview page.
An Oracle Streams topology displays a graphical representation of the local database and other databases that interact with the local database in the Oracle Streams environment. In a replication environment, the topology shows the following information about the databases displayed:
The database links used by propagations from the current database to other databases in the Oracle Streams environment. Each arrow that originates at the current database shows a database link used by a propagation from the current database to another database. Replication environments use database links to send changes made to replicated objects to other databases.
The database links used by propagations from other databases in the Oracle Streams environment to the current database for which an apply process at the current database applies the propagated messages. Each arrow that terminates at the current database shows a database link used by a propagation from another database to the current database whose messages are applied at the current database.
To view the Oracle Streams topology:
In Oracle Enterprise Manager, log in to the database as the Oracle Streams administrator.
Go to the Database Home page.
Click Data Movement to open the Data Movement subpage.
Click Manage in the Streams section.
The Streams page appears, showing the Overview subpage.
Scroll down until you see the Oracle Streams topology.
You can use the Overview window to select a particular portion of the topology to view in detail and to zoom in and zoom out. You can also select a database in the topology and view the Selection Details window for information about the database.
Click Help or the Legend link for more information about the Oracle Streams topology.
The following graphic shows an example of the Oracle Streams topology for an Oracle Streams replication environment:
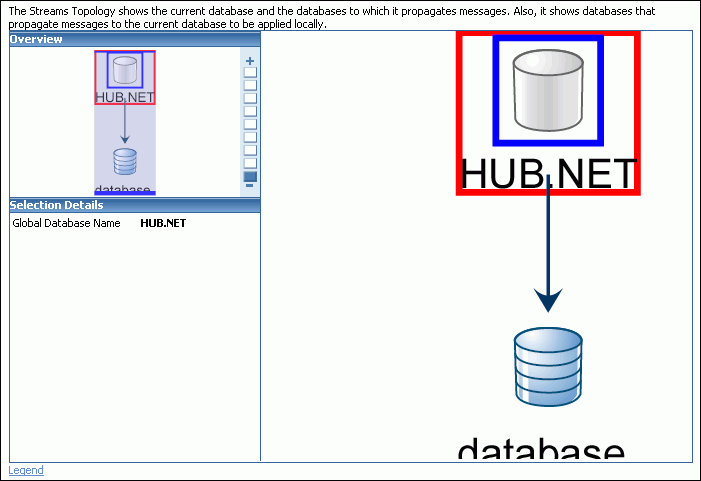
The Oracle Streams topology in the previous figure includes the following elements:
The current database is named database.
The ii1.net database is part of the replication environment that interacts with the current database.
The ii1.net database sends changes to the current database, and these changes are applied by an apply process at the current database.
The current database sends changes to the ii1.net database.
In addition to the graphical display of the Oracle Streams topology in Enterprise Manager, you can use the DBMS_STREAMS_ADVISOR_ADM package to gather information about the Oracle Streams topology. After this information is gathered, you can view the Oracle Streams topology by querying the following data dictionary views:
DBA_STREAMS_TP_COMPONENT contains information about each Oracle Streams component at each database.
DBA_STREAMS_TP_COMPONENT_LINK contains information about how messages flow between Oracle Streams components.
DBA_STREAMS_TP_COMPONENT_STAT contains statistics about each Oracle Streams component.
DBA_STREAMS_TP_DATABASE contains information about each database that contains Oracle Streams components.
DBA_STREAMS_TP_PATH_BOTTLENECK contains information about Oracle Streams components that might be slowing down the flow of a stream.
DBA_STREAMS_TP_PATH_STAT contains statistics about each stream that exists in the Oracle Streams topology.
When you gather information using the DBMS_STREAMS_ADVISOR_ADM package, the Oracle Streams Performance Advisor places information about Oracle Streams performance in these views. You can query these views to determine how Oracle Streams components are performing currently and for information about ways to make them perform better.
See Also:
"Displaying an Overview of the Replication Components at a Database"
Oracle Streams Concepts and Administration for more information about using the DBMS_STREAMS_ADVISOR_ADM package, the topology data dictionary views, and Oracle Streams Performance Advisor
You can use Enterprise Manager to view detailed information about capture processes. You can also view statistics for capture processes.
The following topics describe monitoring capture processes:
You can use Enterprise Manager to view information about a capture process. This information includes the capture process status and state, the rules used by the capture process, and other information about the capture process.
To view detailed information about a capture process in Enterprise Manager:
In Oracle Enterprise Manager, log in to the database as the Oracle Streams administrator.
Go to the Database Home page.
Click Data Movement to open the Data Movement subpage.
Click Manage in the Streams section.
The Streams page appears, showing the Overview subpage.
Click Capture to open the Capture subpage.

The Capture subpage shows general information about each capture process in the database. This information includes capture process rule sets, queue, state, and status. Click Help for more information about the Capture subpage.
Select the capture process that you want to monitor.
Click View to open the View Capture Details page.
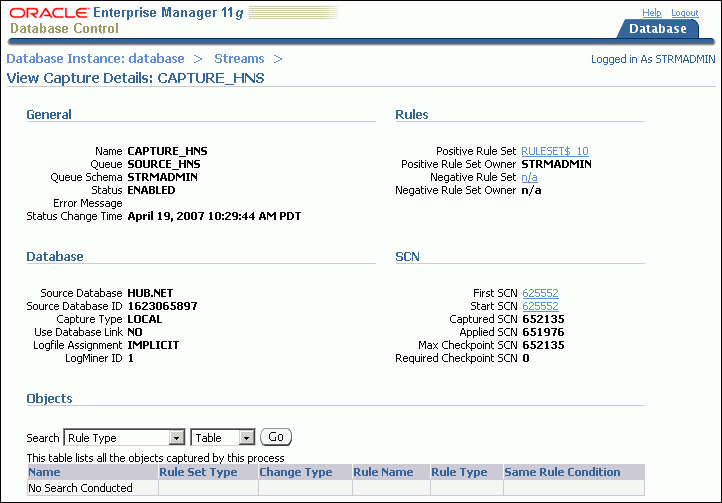
The View Capture Details page includes detailed information about the capture process. It also enables you to display the database objects for which the capture process captures changes. Rules control which database changes are captured by a capture process. Use the search tool in the Objects section to display the capture process rules:
To display all of the rules in the positive rule set, choose Positive Rule Type and click Go. Positive rules instruct a capture process to capture changes to database objects.
To display all of the rules in the negative rule set, choose Negative Rule Type and click Go. Negative rules instruct a capture process not to capture changes to database objects.
Click Help for more information about this page.
You can use Enterprise Manager to view statistics for a capture process. The statistics include the number of messages in the capture process queue, the number of messages captured and enqueued by the capture process, and other statistics relating to the capture process.
To view statistics for a capture process in Enterprise Manager:
In Oracle Enterprise Manager, log in to the database as the Oracle Streams administrator.
Go to the Database Home page.
Click Data Movement to open the Data Movement subpage.
Click Manage in the Streams section.
The Streams page appears, showing the Overview subpage.
Click Capture to open the Capture subpage.

The Capture subpage shows general information about each capture process in the database. This information includes capture process rule sets, queue, state, and status. Click Help for more information about the Capture subpage.
Select the capture process that you want to monitor.
Click Statistics to open the View Capture Statistics page.
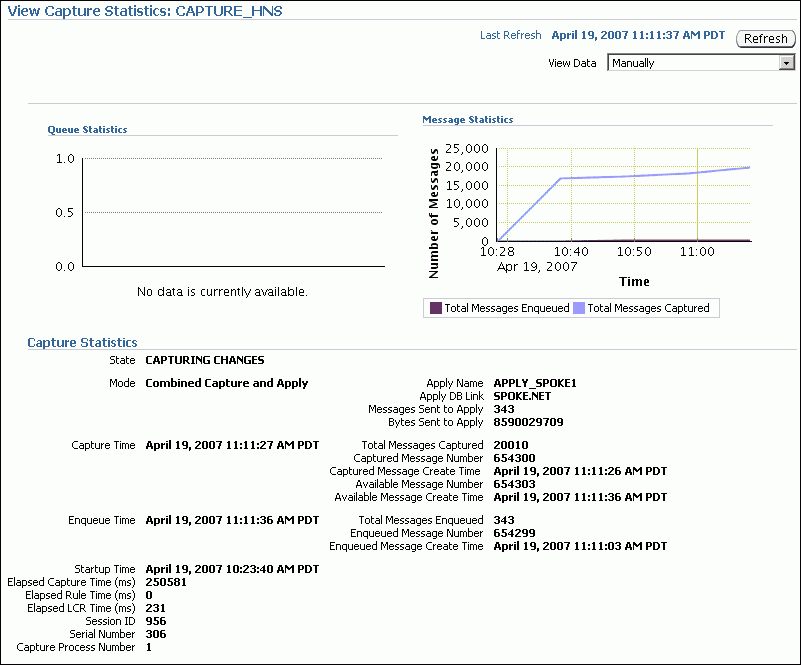
The View Capture Statistics page includes the following information:
The Queue Statistics graph shows the number of messages currently in the capture process queue. The No of Enqueued Messages line in the graph shows the total number of messages currently in the buffered queue. The No of Spilled Messages line in the graph shows the total number of messages that have spilled from memory into the persistent queue table.
The Message Statistics graph shows the total number of changes enqueued and captured by the capture process since it last started. Total Messages Enqueued shows the number of changes enqueued by the capture process. Total Messages Captured shows the number of changes that were evaluated in detail against the capture process rules. If a change does not satisfy the capture process rules, then the change is not enqueued.
The Capture Statistics section includes the current state of the capture process, as well as statistics related to time and changes (messages) captured. See the documentation for the V$STREAMS_CAPTURE dynamic performance view in Oracle Database Reference for more information about these statistics.
Click Help for more information about this page.
You can use Enterprise Manager to view detailed information about propagations. You can also view statistics for propagations.
The following topics describe monitoring propagations:
You can use Enterprise Manager to view information about a propagation. This information includes the propagation status, whether the propagation has failed, the rules used by the propagation, and other information about the propagation.
To view information about a propagation in Enterprise Manager:
In Oracle Enterprise Manager, log in to the database as the Oracle Streams administrator.
Go to the Database Home page.
Click Data Movement to open the Data Movement subpage.
Click Manage in the Streams section.
The Streams page appears, showing the Overview subpage.
Click Propagation to open the Propagation subpage.

Select the propagation that you want to monitor.
Click View to open the View Propagation Details page for the propagation.
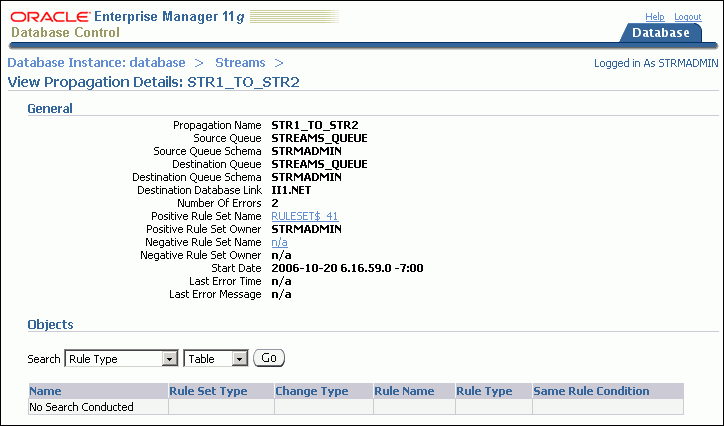
The View Propagation Details page includes detailed information about the propagation. It also enables you to display the database objects for which the propagation sends changes. Rules control which database changes are sent by a propagation. Use the search tool in the Objects section to display the propagation rules:
To display all of the rules in the positive rule set, choose Positive Rule Type and click Go. Positive rules instruct a propagation to send changes to database objects to the destination queue.
To display all of the rules in the negative rule set, choose Negative Rule Type and click Go. Negative rules instruct a propagation not to send changes to database objects to the destination queue.
Click Help for more information about this page.
You can use Enterprise Manager to view statistics for a propagation. The statistics include the number of messages in the propagation source queue, the number of messages sent by the propagation, and other statistics relating to the propagation.
Note:
Propagation statistics are not calculated when combined capture and apply is used instead of propagation.To view statistics for a propagation in Enterprise Manager:
In Oracle Enterprise Manager, log in to the database as the Oracle Streams administrator.
Go to the Database Home page.
Click Data Movement to open the Data Movement subpage.
Click Manage in the Streams section.
The Streams page appears, showing the Overview subpage.
Click Propagation to open the Propagation subpage.

Select the propagation that you want to monitor.
Click Statistics to open the View Propagation Statistics page for the propagation.
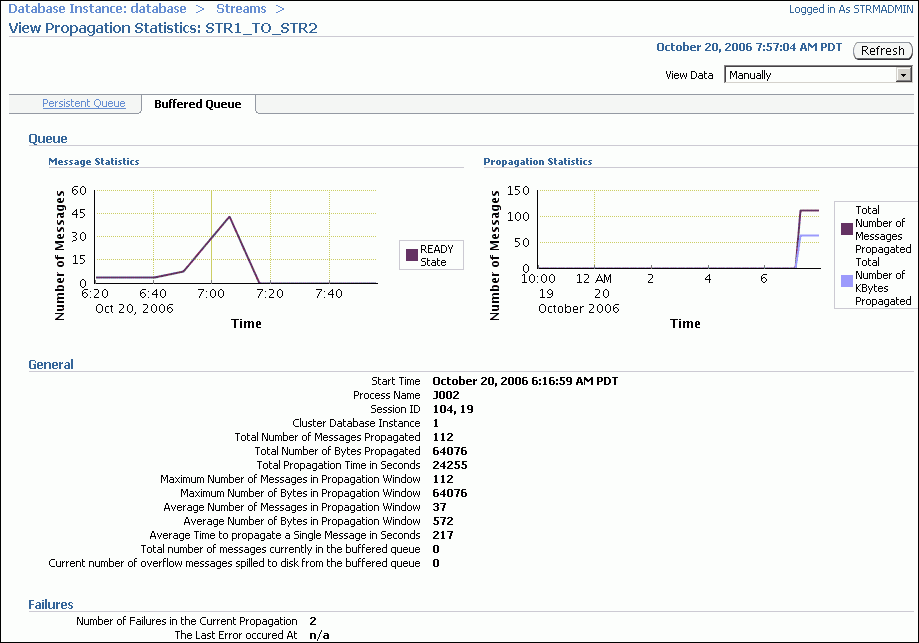
The View Propagation Statistics page includes the following subpages:
The Persistent Queue subpage shows propagation statistics for messages that were enqueued into the persistent queue portion of the queue used by the propagation. Use this subpage to view propagation statistics if the propagation sends changes captured by a synchronous capture.
The Buffered Queue subpage shows propagation statistics for messages that were enqueued into the buffered queue portion of the queue used by the propagation. Use this subpage to view propagation statistics if the propagation sends changes captured by a capture process.
Both subpages contain graphs that show the number of messages in the queue and the number of messages sent by the propagation over several hours. Both subpages also contain other propagation statistics, such as the total number of messages and bytes propagated since the propagation was last started. Click Help for more information about the statistics on the current subpage.
See Also:
Oracle Streams Concepts and Administration for information about combined capture and apply
You can use Enterprise Manager to view detailed information about apply processes. You can also view statistics for apply processes.
The following topics describe monitoring apply processes:
You can use Enterprise Manager to view information about an apply process. This information includes the apply process status and state, the rules used by the apply process, and other information about the apply process.
To view information about an apply process in Enterprise Manager:
In Oracle Enterprise Manager, log in to the database as the Oracle Streams administrator.
Go to the Database Home page.
Click Data Movement to open the Data Movement subpage.
Click Manage in the Streams section.
The Streams page appears, showing the Overview subpage.
Click Apply to open the Apply subpage.

Select the apply process that you want to monitor.
Click View to open the View Apply Details page.
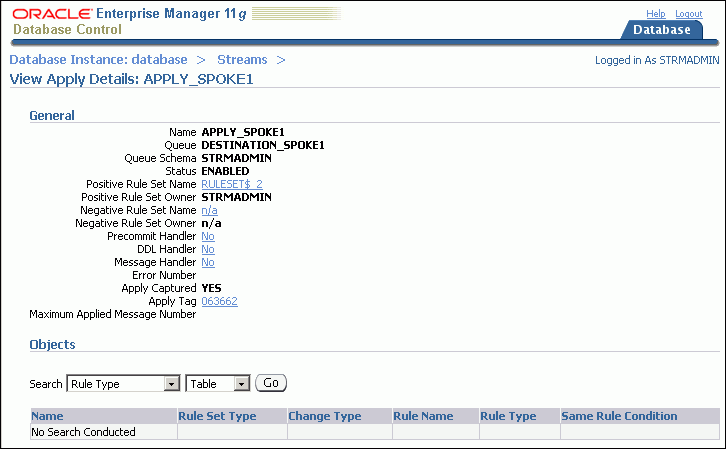
The View Apply Details page includes detailed information about the apply process. It also enables you to display the database objects for which the apply process applies changes. Rules control which database changes are dequeued and applied by an apply process. Use the search tool in the Objects section to display the apply process rules:
To display all of the rules in the positive rule set, choose Positive Rule Type and click Go. Positive rules instruct an apply process to dequeue and apply changes to database objects.
To display all of the rules in the negative rule set, choose Negative Rule Type and click Go. Negative rules instruct an apply process not to dequeue changes to database objects.
Click Help for more information about this page.
You can use Enterprise Manager to view statistics for an apply process. The statistics include the number of messages in the apply process queue, the number of messages applied by the apply process, and other statistics relating to the apply process.
To view statistics for an apply process in Enterprise Manager:
In Oracle Enterprise Manager, log in to the database as the Oracle Streams administrator.
Go to the Database Home page.
Click Data Movement to open the Data Movement subpage.
Click Manage in the Streams section.
The Streams page appears, showing the Overview subpage.
Click Apply to open the Apply subpage.

Select the apply process that you want to monitor.
Click Statistics to open the View Apply Statistics page.
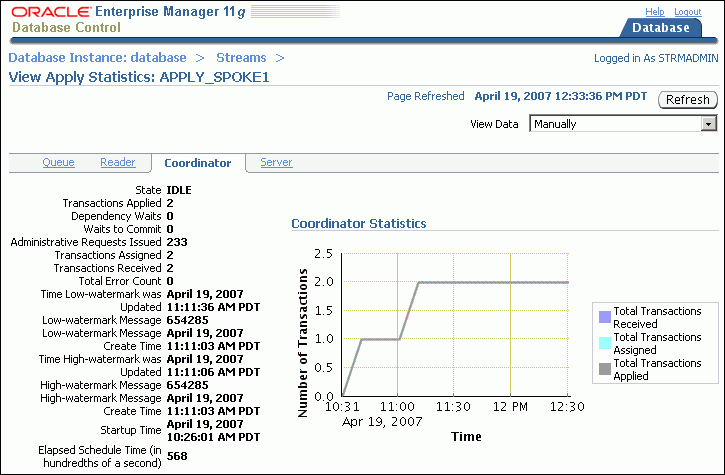
The View Apply Statistics page includes the following subpages:
The Queue subpage shows the number of messages over the past several hours in both the persistent queue portion and the buffered queue portion of the apply process queue. If the apply process applies changes captured by a synchronous capture, then analyze the persistent queue statistics. If the apply process applies changes captured by a capture process, then analyze the buffered queue statistics.
The Reader subpage shows statistics for the reader server. The reader server dequeues messages from the apply process queue and assembles them into separate transactions.
The Coordinator subpage shows statistics for the coordinator process. The coordinator process gets transactions from the reader server and passes them to apply servers.
The Server subpage shows statistics for the apply servers. The apply servers apply changes to database objects or pass the changes to apply handlers. To view details about a specific apply server, select it and click View Details.
Click Help for more information about the statistics on the current subpage.
In a replication environment, update conflict handlers automatically resolve conflicts that occur when the same row is updated at two different databases at nearly the same time. You can use the DBA_APPLY_CONFLICT_COLUMNS data dictionary view to list the update conflict handlers.
To display the configured update conflict handlers:
Open SQL*Plus and connect to the database as the Oracle Streams administrator. For example:
sqlplus strmadmin/user-password
See Oracle Database 2 Day DBA for more information about starting SQL*Plus.
Run the following query:
COLUMN OBJECT_OWNER HEADING 'Table|Owner' FORMAT A5
COLUMN OBJECT_NAME HEADING 'Table Name' FORMAT A12
COLUMN METHOD_NAME HEADING 'Method' FORMAT A12
COLUMN RESOLUTION_COLUMN HEADING 'Resolution|Column' FORMAT A13
COLUMN COLUMN_NAME HEADING 'Column Name' FORMAT A30

SELECT OBJECT_OWNER,
       OBJECT_NAME,
       METHOD_NAME,
       RESOLUTION_COLUMN,
       COLUMN_NAME
  FROM DBA_APPLY_CONFLICT_COLUMNS
  ORDER BY OBJECT_OWNER, OBJECT_NAME, RESOLUTION_COLUMN;
The output will be similar to the following:
Table                           Resolution
Owner Table Name   Method       Column        Column Name
----- ------------ ------------ ------------- ------------------------------
HR    COUNTRIES    MAXIMUM      TIME          TIME
HR    COUNTRIES    MAXIMUM      TIME          REGION_ID
HR    COUNTRIES    MAXIMUM      TIME          COUNTRY_NAME
HR    DEPARTMENTS  MAXIMUM      TIME          TIME
HR    DEPARTMENTS  MAXIMUM      TIME          MANAGER_ID
HR    DEPARTMENTS  MAXIMUM      TIME          LOCATION_ID
HR    DEPARTMENTS  MAXIMUM      TIME          DEPARTMENT_NAME
The output in this example shows that latest time conflict resolution is configured for the hr.countries and hr.departments tables. When a conflict occurs for any column listed under Column Name, the change with the maximum, or latest, time in the TIME resolution column is used, and the other change is discarded.
You can use Enterprise Manager to view statistics for a buffered queue that is used by a capture process, propagation, or apply process in your replication environment. In an Oracle Streams replication environment that uses capture processes to capture changes, each capture process enqueues changes into the buffered queue portion of its queue. The changes remain in buffered queues as they are propagated from one queue to another, and apply processes dequeue the changes from a buffered queue.
To view buffered queue statistics:
In Oracle Enterprise Manager, log in to the database as the Oracle Streams administrator.
Go to the Database Home page.
Click Data Movement to open the Data Movement subpage.
Click Manage in the Streams section.
The Streams page appears, showing the Overview subpage.
Click Messaging to open the Messaging subpage.
Select the queue that you want to monitor.
Select Queue Statistics in the Actions list.
Click Go to open the Queue Statistics page.
Click Buffered Queue Statistics to open the Buffered Queue Statistics subpage.
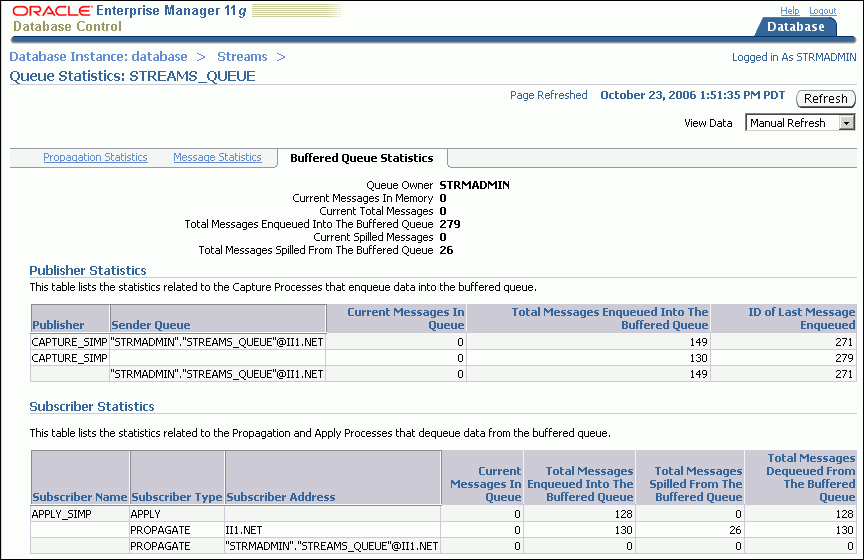
This Buffered Queue Statistics subpage includes the following information about the buffered queue portion of the selected queue:
Information about the number of changes in the queue and the number of changes that have spilled from memory onto disk.
The number of changes enqueued by local capture processes. When the capture process is local, the Sender Queue field is empty.
The number of changes captured by remote capture processes at a different database and sent to the buffered queue. When a capture process is remote, the Sender Queue field contains the queue and database from which the changes were sent.
The number of changes dequeued by local apply processes from the buffered queue.
The number of changes sent by propagations from the buffered queue to a different queue.
Click Help for more information about the statistics on this subpage.
You can query the V$STREAMS_APPLY_COORDINATOR dynamic performance view to monitor the performance of an Oracle Streams replication environment. Specifically, you can query this view to determine the amount of time between when a change was captured at the source database and when it was applied by an apply process at the current database. The query shows the amount of time for a recent change that was applied by each apply process in the current database. In an Oracle Streams replication environment, the amount of time between capture and apply should be relatively short.
Some changes might take longer than others to be captured, propagated, and applied. The query shows the message number of the change you are monitoring, and each change has a different message number. Therefore, you can run this query multiple times to view the amount of time between capture and apply for different changes.
To determine the amount of time between capture and apply for a recent change:
Open SQL*Plus and connect to the database running the apply process as the Oracle Streams administrator. For example:
sqlplus strmadmin/user-password
See Oracle Database 2 Day DBA for more information about starting SQL*Plus.
Run the following query:
COLUMN APPLY_NAME HEADING 'Apply Process Name' FORMAT A30
COLUMN 'Time Between Capture and Apply' FORMAT 999999
COLUMN HWM_MESSAGE_NUMBER HEADING 'Applied Message Number' FORMAT 999999999

SELECT APPLY_NAME,
      (HWM_TIME-HWM_MESSAGE_CREATE_TIME)*86400 "Time in Seconds",
       HWM_MESSAGE_NUMBER
  FROM V$STREAMS_APPLY_COORDINATOR;
The output will be similar to the following:
Apply Process Name             Time in Seconds Applied Message Number
------------------------------ --------------- ----------------------
APPLY_SIMP                                   3                1486062
This section describes the most common problems in an Oracle Streams replication environment. It also describes how to correct these problems.
The following topics describe troubleshooting an Oracle Streams replication environment:
See Also:
Chapter 5, "Administering an Oracle Streams Replication Environment"
Oracle Streams Concepts and Administration for more information about troubleshooting Oracle Streams
Oracle Streams Replication Administrator's Guide for more information about troubleshooting Oracle Streams replication environments
An alert is a warning about a potential problem or an indication that a critical threshold has been crossed. There are two types of alerts:
Stateless: Alerts that indicate single events that are not necessarily tied to the system state. For example, an alert that indicates that a capture aborted with a specific error is a stateless alert.
Stateful: Alerts that are associated with a specific system state. Stateful alerts are usually based on a numeric value, with thresholds defined at warning and critical levels. For example, an alert on the current Oracle Streams pool memory usage percentage, with the warning level at 85% and the critical level at 95%, is a stateful alert.
To view the alerts for a database:
Log in to Enterprise Manager as an administrative user, such as the Oracle Streams administrator.
Go to the Database Home page of the database you want to manage.
View the alerts for the database in the Alerts section. You might need to scroll down to see the Alerts section.
Oracle Streams has its own set of alerts. Table 5-1 describes the alerts related to Oracle Streams.
Table 5-1 Oracle Streams Alerts
| Alert | Message | Alert Type |
|---|---|---|
|
|
STREAMS capture process capture_name aborted with ORA-error_number |
Stateless |
|
|
STREAMS propagation process source_queue, destination_queue, database_link aborted after 16 failures |
Stateless |
|
|
STREAMS apply process apply_name aborted with ORA-error_number |
Stateless |
|
|
STREAMS error queue for apply process apply_name contains new transaction with ORA-error_number |
Stateless |
|
|
Automatically set by alert infrastructure |
Stateful |
Note:
Oracle Streams alerts are informational only. They do not need to be managed. If you monitor your Oracle Streams environment regularly and address problems as they arise, then you might not need to monitor Oracle Streams alerts.See Also:
This topic describes the Capture Aborts alert and explains how to respond to it.
Alert Message
STREAMS capture process capture_name aborted with ORA-error_number.
Alert Type
Stateless
Description
This alert indicates a critical error. The capture process stops and any replication that depends on the capture process also stops. Also, the capture process makes no further progress in scanning the redo log until it is restarted.
Response
Obtain the exact error message in one of the following ways:
In Enterprise Manager, see "Viewing Information About a Capture Process" for instructions.
In SQL*Plus, query the DBA_CAPTURE view.
Take the appropriate action for the error.
After taking the appropriate action, restart the capture process in one of the following ways:
In Enterprise Manager, see "Starting and Stopping a Capture Process" for instructions.
In SQL*Plus, run the START_CAPTURE procedure in the DBMS_CAPTURE_ADM package.
This topic describes the Propagation Aborts alert and explains how to respond to it.
Alert Message
STREAMS propagation process source_queue, destination_queue, database_link aborted after 16 failures.
Alert Type
Stateless
Description
This alert indicates a critical error. The propagation stops, and the messages that are normally sent from one queue to another by the propagation remain in the source queue. Replication that depends on the propagation also stops. Eventually, the source queue can grow too large, and messages can spill to disk. When messages spill to disk, it degrades Oracle Streams performance.
Response
Obtain the exact error message in one of the following ways:
In Enterprise Manager, see "Viewing Information About a Propagation" for instructions.
In SQL*Plus, query the DBA_QUEUE_SCHEDULES view.
Take the appropriate action for the error.
After taking the appropriate action, restart the propagation in one of the following ways:
In Enterprise Manager, see "Enabling and Disabling a Propagation" for instructions.
In SQL*Plus, run the START_PROPAGATION procedure in the DBMS_PROPAGATION_ADM package.
This topic describes the Apply Aborts alert and explains how to respond to it.
Alert Message
STREAMS apply process apply_name aborted with ORA-error_number.
Alert Type
Stateless
Description
This alert indicates a critical error. The apply process stops, and the messages that are normally dequeued by the apply process remain in the apply process queue. Replication that depends on the apply process also stops. Eventually, the apply process queue can grow too large, and messages can spill to disk. Other queues that send messages to the apply process queue might also grow and spill messages to disk. When messages spill to disk, it degrades Oracle Streams performance.
Response
Obtain the exact error message in one of the following ways:
In Enterprise Manager, see "Viewing Information About an Apply Process" for instructions.
In SQL*Plus, query the DBA_APPLY view.
Take the appropriate action for the error. If the error is an ORA-26714 error, then consider setting the DISABLE_ON_ERROR apply process parameter to N to avoid aborting on future user errors. See "Setting an Apply Process Parameter" for instructions.
After taking the appropriate action, restart the apply process in one of the following ways:
In Enterprise Manager, see "Starting and Stopping an Apply Process" for instructions.
In SQL*Plus, run the START_APPLY procedure in the DBMS_APPLY_ADM package.
This topic describes the Apply Error alert and explains how to respond to it.
Alert Message
STREAMS error queue for apply process apply_name contains new transaction with ORA-error_number.
Alert Type
Stateless
Description
This alert indicates that the apply process encountered an error when it was applying a transaction. The apply process moves all of the messages in the transaction to the error queue. Other transactions that depend on the error transaction might also result in apply errors, and the error queue might grow quickly. Therefore, an administrator should resolve the apply errors as soon as possible.
Response
Manage the apply errors in the error queue in one of the following ways:
In Enterprise Manager, see "Managing Apply Errors" for instructions.
In SQL*Plus, query the DBA_APPLY_ERROR view to view the errors, resolve the errors, and either execute or delete the errors using procedures in the DBMS_APPLY_ADM package.
This topic describes the Oracle Streams Pool alert and explains how to respond to it.
Alert Message
The message is set automatically by the alert infrastructure.
Alert Type
Stateful
Description
A metric is a unit of measurement used to report the health of the system. This alert is generated when the memory usage of the Oracle Streams pool has exceeded the percentage specified by the STREAMS_POOL_USED_PCT metric.
This alert can be raised only if the database is not using Automatic Memory Management or Automatic Shared Memory Management. Specifically, this alert can only be raised if the following initialization parameters are set to 0 (zero) or are unset:
MEMORY_TARGET
SGA_TARGET
Note:
Oracle recommends using either Automatic Memory Management or Automatic Shared Memory Management.Response
This metric threshold can be set automatically by the alert infrastructure, or you can set it using Enterprise Manager. If the currently running workload is typical, then consider increasing the size of the Oracle Streams pool. Some of the links under the Related Topics heading on the Database Home page enable you to manage metrics. See Oracle Database 2 Day DBA for information about viewing and setting metric thresholds.
Apply errors can occur for a variety of reasons. When a change in a transaction causes an apply error, the apply process moves the change and all of the other changes in the same transaction to the error queue. When apply errors occur, you must identify the cause of the error and correct it. You can retry a specific error transaction or you can retry all error transactions for an apply process.
The following topics describe managing apply errors:
See Also:
You might need to make data manipulation language (DML) or data definition language (DDL) changes to database objects to correct the conditions that caused one or more apply errors before you retry error transactions. If you must make changes to a database object, but you do not want to replicate these changes, then set a session tag in the session that makes the changes.
For example, to update the hr.employees table to correct an apply error:
Open SQL*Plus and connect as a user who can update the hr.employees table. For example:
sqlplus hr/user-password@ii1.net
See Oracle Database 2 Day DBA for more information about starting SQL*Plus.
BEGIN
   DBMS_STREAMS.SET_TAG(
      tag  =>  HEXTORAW('1D'));
END;
/
Ensure that you set the tag to a value that prevents changes from being captured by capture processes and synchronous captures.
Update the hr.employees table to correct the error.
Exit the SQL*Plus session.
After you correct the problem that caused one or more error transactions, you can retry the error transactions or delete them. See "Retrying or Deleting Apply Error Transactions" for instructions.
For information about specific apply errors and how to correct them, see Oracle Streams Replication Administrator's Guide.
"Correcting Apply Errors in Database Objects" describes correcting the problem that caused one or more error transactions. After you correct the problem, you can retry the error transactions or delete them:
Retry the transactions if the changes in the transaction should be made to the destination table. Retry them only if you have not already modified the data in the table to make these changes.
Delete the transactions if you made all of the changes in the transactions to the destination table, or if the changes should not be made to the table.
To retry or delete apply error transactions:
In Oracle Enterprise Manager, log in to the database as the Oracle Streams administrator.
Go to the Database Home page.
Click Data Movement to open the Data Movement subpage.
Click Manage in the Streams section.
The Streams page appears, showing the Overview subpage.
Click Apply to open the Apply subpage.

Select the apply process with error transactions.
Click Errors to open the Apply Errors page.
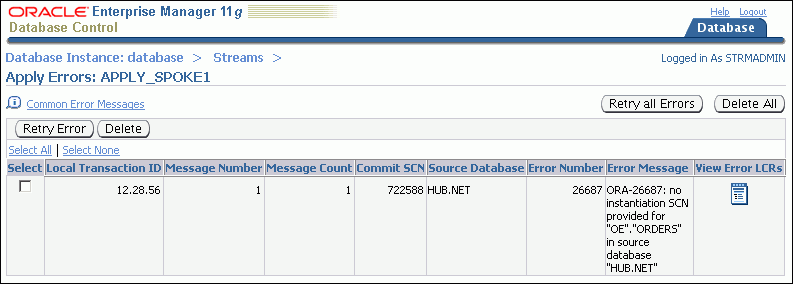
You can view detailed information about an error by clicking the icon in the View Error LCRs field for the error transaction. The detailed information includes each change in the transaction. You can also drill down further to compare a change with the data in the table to which the change should be applied. Click Help on the current page for information about the page.
On the Apply Errors page, complete one of the following actions:
To retry all error transactions, click Retry all Errors.
To delete all error transactions, click Delete All.
To retry a specific error transaction, select the error transaction and click Retry Error.
To delete a specific error transaction, select the error transaction and click Delete.
Sometimes, a destination queue in an Oracle Streams replication environment stops accepting propagated changes. The destination queue might stop accepting changes if, for example, the database that contains the queue goes down, there is a problem with the destination queue, the computer system running the database that contains the queue goes down, or for some other reason.
When a destination is unavailable in a replication environment that uses capture processes, captured changes that cannot be sent to a destination queue remain in the source queue. The source queue size increases and, eventually, the changes spill out of the buffered queue memory onto disk. When this happens, the performance of the Oracle Streams replication environment suffers.
To determine whether a large number of captured changes are spilling to disk, follow the instructions in "Viewing Statistics for a Capture Process". The Queue Statistics graph shows the current number of changes spilling to disk in the capture process queue.
If your replication environment uses capture processes to capture changes, then you can use the SPLIT_STREAMS and MERGE_STREAMS_JOB procedures in the DBMS_STREAMS_ADM package to manage an unavailable destination.
To manage the unavailable destination:
Use the SPLIT_STREAMS procedure to split off the stream for the problem destination from all of the other streams flowing from a capture process to other destinations.
The SPLIT_STREAMS procedure clones the capture process, queue, and propagation, and the cloned versions of these components are used by the stream that is split off. While the stream that cannot propagate changes is split off, the streams to other destinations proceed as usual.
Correct the problem that is causing the destination to be unavailable.
Use the MERGE_STREAMS_JOB procedure to merge the split stream back to the original capture process. MERGE_STREAMS_JOB can be run automatically by a merge job created by the SPLIT_STREAMS procedure. After the merge operation completes, the original replication environment is restored.
See Also:
Oracle Streams Replication Administrator's Guide for detailed instructions about using split and merge