| C H A P T E R 4 |
|
Debugging a Program |
This chapter discusses how to debug message-passing programs in the Prism environment. It also describes how to use events to control the execution of a program.
Note that many principles that apply to debugging serial programs also apply to debugging message-passing programs. However, debugging a message-passing program can be considerably more complex than debugging a serial program, since you are in effect debugging multiple individual programs concurrently. The Prism environment's concept of psets lets you focus your debugging efforts on the processes that are of particular interest.
For information about debugging serial programs, see Appendix C.
This chapter is organized into the following sections:
A typical approach to debugging is to stop the execution of a program at different points so that you can perform various actions, such as checking the values of variables. You stop execution by setting a breakpoint. If you perform a trace, execution stops, then automatically continues.
In the Prism environment, breakpoints and traces are referred to as events. Before the execution of a program begins. you can specify what events are to take place during execution. When an event occurs:
1. The execution pointer moves to the current execution point.
2. A message is printed in the command window.
3. If you specified that an action was to accompany the event, it is performed. An example of this might be to print a variable's value.
4. If the event is a trace, execution then continues. If it is a breakpoint, execution does not resume until you explicitly order it to.
The Prism environment provides various ways of creating these events -- for example, by issuing commands or by using the mouse in the source window. Setting Breakpoints describes how to create breakpoint events; Tracing Program Execution describes how to create trace events. Using the Event Table describes the Event Table, which provides a unified method for listing, creating, editing, and deleting events.
See Events Taking Pset Qualifiers for a discussion of events in the Prism environment.
You can define events so that they occur:
You can include one or more Prism commands as actions that are to take place as part of the event. One example of this would be to define an event that tells the Prism environment to stop at line 25, print the value of x, and do a stack trace.
The Event Table provides a unified method for controlling the execution of a program. Creating an event in any of the ways discussed later in this chapter adds an event to the list in this table. You can also display the Event Table and modify its contents directly by:
To display the Event Table, select Event Table from the Events menu.
This section describes the general process of using the Event Table.
FIGURE 4-1 shows the Event Table.
The top area of the Event Table is the event list -- a scrollable region in which events are listed. When you execute the program, the Prism environment uses the events in this list to control execution. Each event is listed in the format you would use to enter it as a command in the command window. It is prefaced by an ID number assigned by the Prism environment, which is 1 in the FIGURE 4-1 example.
The middle area of the Event Table is a series of fields that you fill in when editing or adding an event; not all of the fields are relevant to every event. The fields are:
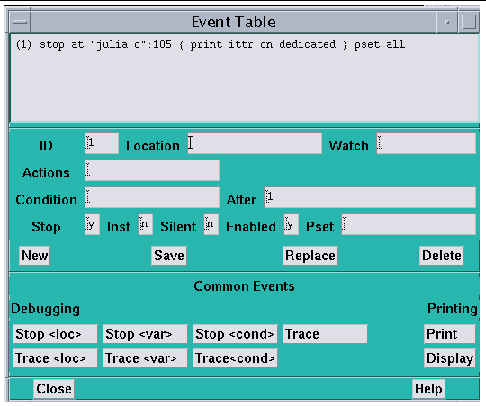
The buttons beneath these fields are for use in creating and deleting events; they are described below.
The area headed Common Events contains buttons that provide shortcuts for creating certain standard events.
Click on Close or press the Esc key to cancel the Event Table window.
You can either add an event explicitly, editing field by field, or you can use the Common Events buttons to automatically fill in some of the fields for you. You can add an event from the beginning if it is not similar to any of the categories covered by the Common Events buttons.
All values currently in the fields are cleared.
2. Fill in the relevant fields to create the event.
3. Click on the Save button to save the new event.
1. Click on the button for the event you want to add -- for example, Print.
This fills in certain fields and highlights all fields that you need to fill in.
2. Fill in the highlighted field(s).
You can also edit other fields if you like.
3. Click on Save to add the event to the event list.
Most of these Common Events buttons are also available as separate selections in the Events menu. This lets you add one of these events without having to display the entire Event Table. The menu selections, however, prompt you only for the field(s) you must fill in. You cannot edit other fields.
Individual Common Events buttons are discussed throughout the remainder of this guide.
You can also create a new event by editing an existing event; see Editing an Existing Event.
You can delete events using the Event Table or the Delete selection from the Events menu.
1. Click on the line representing the event in the Event Table or move to it with the up and down arrow keys.
This causes the components of the event to be displayed in the appropriate fields beneath the list.
2. Click on the Delete button.
You can also select Delete from the Events menu to display the Event Table. You can then follow the procedure described above.
Deleting a breakpoint at a program location also deletes the B in the line-number region at that location.
You can edit an existing event to change it or to create a new event similar to it.
1. Click on the line representing the event in the event list or move to it with the up or down arrow keys.
This causes the components of the event to be displayed in the appropriate fields beneath the list.
You can, for example, change the Location field to specify a different location in the program.
3. Save the newly edited event.
Click on the Save button to save the new event in addition to the original version of the event; it is given a new ID and is added to the end of the event list. Clicking on Save is a quick way of creating a new event similar to an event you have already created.
You can disable and enable events. When you disable an event, the Prism environment keeps it in the event list, but it no longer affects execution. You can subsequently enable it when you once again want it to affect execution. This can be more convenient than deleting events and then redefining them.
In the following example, the sequence of commands displays the event list, then disables an event, and then redisplays the event list:
(prism all) show events (1) trace (2) when stopped { print board } (prism all) disable 1 event 1 disabled (prism all) show events (1) trace (disabled) (2) when stopped { print board } |
Events that you create for a program are automatically maintained when you reload the same program during a Prism session. This saves you the effort of redefining these events each time you reload a program.
You can use Prism commands to save your events to a file and then execute them from the file rather than interactively.
1. Redirect the output to a file.
For example,the following redirects the list of events to the file primes.events:
(prism all) show events @ primes.events
2. Edit primes.events to remove the ID number at the beginning of each event.
This leaves you with a list of Prism commands.
(prism all) source primes.events
This reads in and executes the commands from primes.events.
Events in the Prism environment can take a pset qualifier.
 Type the pset name in the Pset field in the Event Table, as shown in FIGURE 4-2.
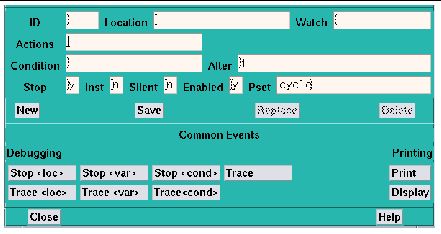
If you do not supply a pset qualifier, the event applies to the current pset.
In the following example, the current pset is all.
(prism all) stop in receive pset notx
Because the pset notx is specified, this command sets a breakpoint in the receive routine for the processes in the set notx. Each process in pset notx stops when it reaches this routine. It is possible, of course, that some processes may never reach this routine. This might become an issue when you include actions in an event.
The following command stops execution for any process in the current pset if the process's value for the variable x is greater than 10.
Because no other pset was specified in this example, this event applies to the current pset, which is all. The Prism environment evaluates the expression in the condition locally -- that is, separately for each process. Similarly, if a and b are arrays, the following commandstops execution for a process in the current set if the sum of the values of a in that process is greater than the sum of the values of b:
(prism all) stop if sum(a) > sum(b)
All processes that are stopped at breakpoints are members of the predefined pset break.
The following command causes the processes in pset notx to continue running:
If you use a dynamic pset as a qualifier for an event, its membership is evaluated when you issue the command defining the event. Thus, the following command creates a breakpoint only in the processes that are interrupted at the time the command is issued:
(prism all) stop at 10 pset interrupted
If no processes are currently interrupted, you will receive an error message.
One result of this is that you cannot define events that involve dynamic psets before the program starts execution.
If you specify a user-defined variable pset as a qualifier, its membership is determined by the most recent eval pset command issued for that pset.
As is the case with dynamic psets, you cannot define events that involve variable psets before the program starts execution.
Events in the Prism environment can take action clauses. For example, the following action clause prints x for the pset foo when the members of foo are stopped at line 10:
(prism all) stop at 10 {print x} pset foo
You can include an eval pset command as an event action. For example, this evaluates the pset sending when all the members of the current pset are stopped in send:
(prism all) stop in send {eval pset sending}
You receive error messages if it is impossible to evaluate membership in a pset. This would happen, for example, if a variable in the set definition is not active.
Note these limitations in using event actions:
(prism all) show events (processnumber)
This displays all events associated with the specified process.
Issuing show events with no arguments has its standard behavior. That is, it prints out all events, as shown in the following example:
(prism all) show events (1) trace (2) when stopped { print board } (prism all) disable 1 event 1 disabled (prism all) show events (1) trace (disabled) (2) when stopped { print board } |
If you create an event that applies to a particular pset and subsequently delete the pset, the event continues to exist. Its printed representation, however, is changed so that it shows the processes that were members of the pset at the time you deleted the set.
A breakpoint stops execution of a program when a specific location is reached, if a variable or expression changes its value, or if a certain condition is met. This section describes the methods available in the Prism environment for setting a breakpoint.
You can set a breakpoint in the following ways:
The line-number region is easiest for setting simple breakpoints. However, the other two methods give you greater flexibility, such as in setting up a condition under which the breakpoint is to take place.
In all cases, an event is added to the list in the Event Table. If you delete the breakpoint using any of the methods described in this section, the corresponding event is deleted from the event list. If you set a breakpoint at a program location, a B appears next to the line number in the line-number region.
|
Note - Secondary (spawned) Prism sessions do not inherit breakpoints set within primary Prism sessions. |
To use the line-number region to set a breakpoint, the line at which you want to stop execution must appear in the source window. If it does not, you can scroll through the source window (if the line is in the current file) or use the File or Func selection from the File menu to display the source file you are interested in.
1. Position the mouse pointer to the right of the line numbers.
2. Move the pointer next to the line at which you want to stop execution.
A B is displayed, indicating that a breakpoint has been set for that line.
A message appears in the command window confirming the breakpoint, and an event is added to the event list.
The source line you choose must contain executable code; if it does not, you receive a warning in the command window, and no B appears where you clicked.
4. Shift-click on the letter in the line-number region to display the complete event
(or events) associated with it.
See Using the Line-Number Region for more information on the line-number region.
 Left-click on the B that represents the breakpoint you want to delete.
The B disappears; a message appears in the command window, confirming the deletion.
As described in Moving Through the Source Code, you can split the source window to display source code and the corresponding assembly code.
You can set a breakpoint in either pane. The B appears in the line-number region of both panes, unless you set the breakpoint at an assembly code line for which there is no corresponding source line.
Deleting a breakpoint from one pane of the split source window deletes it from the other pane as well.
1. Select Stop <loc> or Stop <var> from the Events menu.
These choices are also available as Common Events buttons within the Event Table itself; see Adding an Event.
2. Perform one of the following:
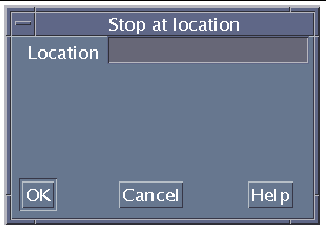
See Writing Expressions in the Prism Environment for more information on expressions.
You can also use the Event Table to create combinations of these breakpoints; for example, you can create a breakpoint that stops at a location if a condition is met.
In addition, you can use the Actions field of the Event Table to specify the Prism commands that are to be executed when execution stops.
For more information about deleting events, see Deleting an Existing Event.
The when command is an alias for the stop command.
The syntax of the stop command is also used by the stopi, when,trace, and tracei commands. The general syntax for these commands is:
command [variable | at line | in func] [if expr] [{cmd[; cmd...]}] [after n]
The first option listed (specifying the location or the name of the variable) must come first on the command line. The other options, if you include them, can be in any order.
For the when command, you can use the keyword stopped to specify that the actions are to occur whenever the program stops execution.
When you issue the command, an event is added to the event list. If the command sets a breakpoint at a program location, a B appears in the line-number region next to the location.
To stop execution the tenth time in function foo and print a, type:
(prism all) stop in foo {print a} after 10
To stop at line 17 of file bar if a is equal to 0, type:
(prism all) stop at "bar":17 if a == 0
To stop whenever a changes, type:
(prism all) stop a
To stop the third time a equals 5, type:
(prism all) stop if a .eq. 5 after 3
To print a and do a stack trace every time the program stops execution, type:
(prism all) when stopped {print a; where}
(prism all) stopi at machine-address
For example, the following command stops execution at address 1000 (hex):
The history region displays the address and the machine instruction. The source pointer moves to the source line being executed.
This prints out the event list. Each event has an ID number associated with it.
(prism all) delete ID [ID ...]
List the ID numbers of the events you want to delete; separate multiple IDs with one or more blank spaces. For example,this deletes the events with IDs 1 and 3. Use the argument all to delete all existing events:
delete 1 3
You can trace program execution by using the Event Table or Events menu or by issuing commands. All methods add an event to the Event Table. If you trace a source line, the Prism environment displays a T next to the line in the line-number region.
Tracing is essentially the same as setting a breakpoint, except that execution continues automatically after the breakpoint is reached. When tracing source lines, the Prism environment steps into procedures if they were compiled with the -g option; otherwise it steps over them as if it had issued a next command.
|
|
 Select Trace, Trace <loc>, or Trace <var> from the Events menu.
These choices are also available as Common Events buttons within the Event Table itself.
For variations of these traces, you can create your own event in the Event Table. You can also use the Actions field to specify Prism commands that are to be executed along with the trace.
 Choose the Delete selection from the Events menu, or use the Delete button in the Event Table.
For more information about deleting existing events, see Deleting an Existing Event.
Issuing trace with no arguments causes each source line in the program to be displayed in the command window before it is executed.
The trace command uses the same syntax as the stop command; see Setting a Breakpoint Using Commands. For example:
To trace and print a on every source line, type:
To trace line 17 if a is greater than 10, type:
(prism all) trace at 17 if a .GT. 10
In addition, the Prism environment interprets these two commands as being the same:
(prism all) trace at line-number
When tracing machine instructions, the Prism environment follows all procedure calls down. The tracei command has the same syntax as the stop command; see Setting a Breakpoint Using Commands.
The history region displays the address and the machine instruction. The execution pointer moves to the next source line to be executed.
This obtains the ID associated with the trace.
For further information, see Setting a Breakpoint Using Commands.
The call stack is the list of procedures and functions currently active in a program. The Prism environment provides you with methods for examining the contents of the call stack.
See Displaying the Where Graph for a discussion of displaying the call stack graphically in the Prism environment.
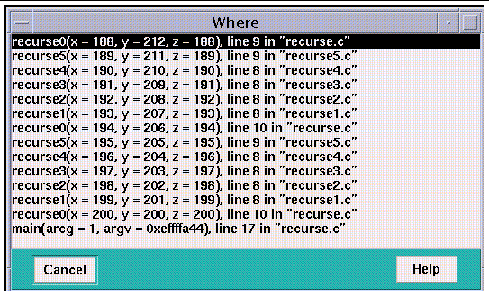
Values of arguments in displayed procedures are shown in the default radix, which is decimal unless you change it via the set $radix command; see To Change the Default Radix.
Moving up through the call stack means heading toward the main procedure. Moving down through the call stack means heading toward the current stopping point in the program.
Moving through the call stack changes the current function and repositions the source window at this function. It also affects the scope that the Prism environment uses for interpreting the names of variables in expressions and commands. See Scope in the Prism Environment for more information.
Selecting Where from the Debug menu displays the call stacks for the program being debugged. A multiprocess program can have multiple call stacks, one for each process. A threaded program can have a separate stack for each thread in each process.
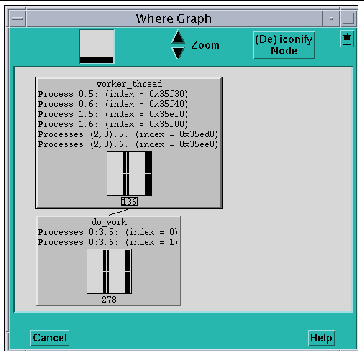
To show the relationships among these call stacks, the Prism environment provides a Where graph; this window displays a snapshot of the dynamic call graph of the program. The Where graph displays information about all processes that are not running.
A window like the one shown in FIGURE 4-5 is displayed.
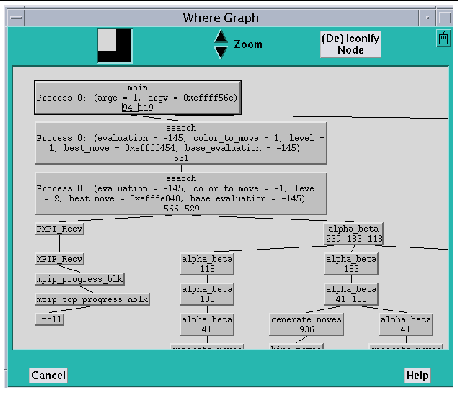
The Where graph centers on the current process of the current pset. That is, the processes related to it are lined up in a single column. In FIGURE 4-5, process 0 is the current process. If you change the current process, the Where graph rearranges itself. The default zoom level of the Where graph shows the arguments for the current process.
The line numbers at the bottom of each box indicate where processes branch.
|
|
 Shift-click in each function's box.
This displays a pop-up window showing the numbers of the processes with this function in their call stack, along with their arguments.
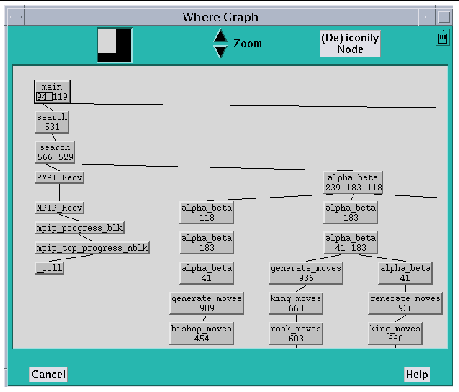
As FIGURE 4-6 shows, the Where graph can get quite large, so the Prism environment provides methods for panning through it and zooming in and out.
The white box in the navigator rectangle at the top of the window shows the position of the display area relative to the entire Where graph.
The box moves to that spot, and the window shows the Where graph in this area of the total display.
 Click on the Zoom down arrow to the right of the navigator.
This reduces the size of the boxes representing the functions and removes information. FIGURE 4-6 shows the Where graph of FIGURE 4-5, zoomed out one level. Note that the information about the current process's arguments is gone.
As you zoom further out, the Where graph removes the line numbers, and one more level after that removes the function names, leaving only boxes connected by lines.
|
|
 Shift-click on a box to display information about it.
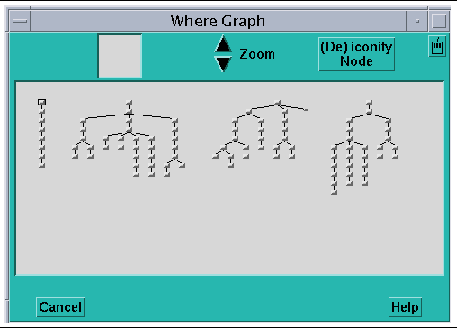
If your program is multithreaded, its call stacks are not rooted at main. Thus, at maximum zoom, the Where graph displays the call stacks as multiple trees, as shown in FIGURE 4-7.
This increases the size of the function boxes and includes more information in them. FIGURE 4-8 shows the Where graph of FIGURE 4-5, zoomed in. In this case, the Where graph shows, for each function, the processes that have that function in their call stack. As in the Psets window, the processes are represented as bitmaps of cells, with numbering starting at the upper left, increasing from left to right and then jumping to the next row.
If your Where graph displays a threaded program, you can zoom in to the level shown in FIGURE 4-9.
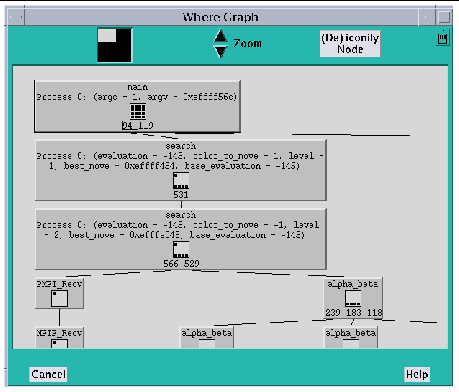
Zooming in another level shows all arguments for all processes.
 Shift-click on the individual stripes.
This displays information about the corresponding threads.
You can shrink selected portions of the Where graph. This is useful if you want to see the overall structure of the graph but also want to focus on certain functions.
When you first display the Where graph, the main function is highlighted.
 Left-click on a function to highlight it. Or, move through the Where graph using the keyboard:
 Press the spacebar while in the Where graph.
When you use the Prism environment on programs that have been compiled with optimization options, Prism commands behave differently and the visibility of variables in the optimized programs changes.
When the control flow is inside a routine that has been compiled with both -g and an optimization option (a debuggable optimized routine), the next and step commands change their behavior:
You can set breakpoints using the stop at command inside debuggable optimized routines only at the first line of such a routine. If the routine name is foo and the first instruction in foo is ADDR_INSTR, then the breakpoint is set as if you had used stop in foo or stopi at ADDR_INSTR.
Note that the following commands are unaffected:
When either return or stepout is used to return control flow to a debuggable optimized routine, the Prism environment assumes that the current position is at the first line of the current routine. The Prism environment makes the same assumption when the source file position is updated as a result of up or down commands that result in a debuggable optimized routine.
Due to the effects of optimization on variable locations in executable programs that have been compiled with optimization, the Prism environment cannot access all variables at all times.
The accessibility of variables can be defined by whether the variables can be used in expressions that require the right value of the variable (such as print X or call foo(X)) or the left value of the variable (such as assign X=1).
The limits of accessibility can be described by the flow of control in an optimized program. When the flow of control is in a routine compiled with both -g and an optimization flag, the following conditions apply:
The following commands can use only accessible variables:
The where command reports all active stack frames that have a stack pointer. The where command does not report routines that have no frame pointer and routines that have been inlined.
|
Note - The where stack displays values only for accessible arguments and `???' for all others. |
When debugging Sun MPI jobs that spawn other Sun MPI jobs, you should be especially careful to ensure that Sun MPI or Prism processes do not exit while other processes depend on communicating with them.
For example, suppose MPI job foo spawns MPI job bar, job foo uses MPI_Send to communicate with a process in job bar,and job bar uses MPI_Recv to handle a message from job foo.
If you are debugging both jobs in the Prism environment and you issue the Prism quit command in the primary Prism session (foo) before the process in foo calls the MPI_Send function, then job foo will exit. However, bar (which you are still debugging in a secondary Prism session) cannot continue past the MPI_Recv call, because foo has already exited.
If you issue a quit -all command in the primary Prism session while debugging a job that has many deeply nested MPI_Comm_spawn calls, it may not terminate all spawned secondary Prism sessions. To terminate a secondary debug session, you must manually issue the quit command in the secondary Prism session(s).
When the Prism environment is started with the -CX option, it opens new X terminal windows in response to the spawning of new processes. It labels a new window with the title aout:jid, where jid is the job ID of the spawned process.
You must set the DISPLAY variable if you debug programs with calls to MPI_Comm_spawn() or MPI_Comm_spawn_multiple(), even when launching the Prism environment with the commands-only interface. For more information about the commands-only interface, see Appendix A.
Several Prism commands perform special functions in spawned Prism sessions.
TABLE 4-1 lists and explains error messages that may be displayed when error conditions are encountered in debugging spawned processes.
For more information about using the Prism environment with Sun MPI programs that issue calls to MPI_Comm_spawn() or MPI_Comm_spawn_multiple(), see Enabling Support for Spawned MPI Processes.
You can issue commands in the command window to display the contents of memory addresses and registers.
 Specify the address on the command line, followed by a slash (/).
The following displays the memory contents at address 10000 (hex).
If you specify the address as a period, the Prism environment displays the contents of the memory address immediately following the one printed most recently.
Specify a symbolic address by preceding the name with an &. For example, this prints the contents of memory for variable x:
The address you specify can be an expression made up of other addresses and the operators +, -, and indirection (unary *). For example, this prints the contents of the location 100 addresses above address 0x1000:
After the slash you can specify how memory is to be displayed. TABLE 4-2 lists the supported memory address formats.
d |
|
D |
|
o |
|
O |
|
x |
|
X |
|
b |
|
c |
|
s |
|
f |
|
F |
|
i |
The initial format is X. If you omit the format in your command, you get either X (if you haven't previously specified a format) or the format you specified previously.
You can print the contents of multiple addresses by specifying a number after the slash (and before the format). For example, this displays the contents of eight memory locations starting at address 0x1000:
These contents are displayed as hexadecimal long words.
You can examine the contents of registers in the same way that you examine the contents of memory.
 Specify a register by preceding its name with a dollar sign.
For example, this prints the contents of the f0 register:
Specify a number after the slash to print the contents of multiple registers. For example, this prints the contents of registers f0, f1, and f2:
(prism all) $f0/3
The order in which the registers are displayed is that shown in TABLE 4-3.
You can also specify a format, as described above. The format specifier controls the display of the output; it doesn't affect how much of the register contents is displayed. Thus, this displays three registers:
The output is displayed as hexadecimal longwords. The following table shows the names and descriptions of UltraSPARC registers
|
Floating-point registers state (SPARC V8 plus only, or higher) |
|
Copyright © 2002, Sun Microsystems, Inc. All rights reserved.