| Oracle® Data Guard Broker 10g Release 1 (10.1) Part Number B10822-01 |
|
|
View PDF |
| Oracle® Data Guard Broker 10g Release 1 (10.1) Part Number B10822-01 |
|
|
View PDF |
This chapter provides several scenarios that show how to use the Oracle Data Guard graphical user interface (GUI) to create, manage, and monitor a Data Guard configuration.
This chapter contains the following scenarios:
Start the Data Guard GUI through the Oracle Enterprise Manager Grid Control using the following steps:
Click the Targets tab to go to the Targets page.
Click Databases to go to the Databases page.
On the Databases page, you see a listing of all discovered databases including the primary database (in this scenario the primary database is called North_Sales). Click the primary database to go to the primary database home page.
Click Administration.
Under the High Availability section, click Data Guard and log in.
|
Note: If you log in as a user with SYSDBA privileges, you will have access to all Data Guard functionality, including all monitoring and management features. If you log in as a non-SYSDBA user, you will have access to monitoring functions only; features such as standby creation, switchover, and failover will not be available. |
If the primary database is not already in a broker configuration, clicking Data Guard in Step 5 will go to the page shown in Figure 5-1. From this page you can create a broker configuration and add a standby database.
If the primary database is already part of a broker configuration, clicking Data Guard in Step 5 will go to the Data Guard Overview page as shown in Figure 5-2.
On the Data Guard Overview page, you can:
Edit the protection mode—click Protection Mode in the Data Guard Overview section to view the current protection mode setting and, if necessary, change the protection mode.
View a summary of standby progress—this chart shows the amount of data that each standby database has not yet received and applied.
Retrieve information about the primary database—click Name, Host, Status, Current Log, or Related Link (Edit) to view pertinent information about the primary database.
If you click Status or Edit, you are taken to the Edit Properties page where you can view and change the current state or properties of the primary database.
View or change information on the standby databases:
Add a standby database to the broker configuration—click Add Standby Database to add a physical or logical standby database.
Change the state or properties—click Edit to go to the Edit Properties page to view and change the current state or properties of the standby database.
Discontinue Data Guard broker control—click Remove to remove the selected standby database from Data Guard broker control.
Switch the role from standby to primary—click Switchover to switch the database roles from standby to primary.
Transition the standby database to the role of primary database— click Failover when a catastrophic failure occurs on the primary database, and there is no possibility of recovering the primary database in a timely manner. The target standby database assumes the primary role, and the failed primary database is disabled by the broker. See Section 4.2.5 for steps to re-create the failed primary database as a standby database to the new primary database.
View performance information for the configuration and status of online redo log files for each standby database:
Click Performance Overview to view information about data archived and applied, a summary of standby progress, and a summary of log services.
Click Log File Details to view the status of online redo log files that were generated on the primary database but not received by the standby, and for online redo log files that were received but not applied to the standby database
Perform additional administrative activities:
Click Verify to check the protection mode and properties, confirm that standby redo log files are present, and verify log switch.
Click Remove Data Guard Configuration to remove the broker configuration from Data Guard broker control.
Search for information about any Data Guard GUI or Enterprise Manager topic—Click Help to display the Welcome to Oracle Data Guard GUI help topic. Once in the help system, you can use the Contents page or Search page to locate help topics of interest.
Creating a broker configuration is the first thing you must do before you can manage and monitor the databases. The Data Guard GUI provides the Add Standby Database wizard to create a broker configuration that includes a primary database and one standby database. (You can use the Add Standby Database wizard later to add more databases. See Section 5.3.) To start the Add Standby Database wizard, click Add Standby Database as shown in Figure 5-3.
After clicking Add Standby Database, select one of the three available options:
Create a new physical standby database (single-instance only)
Create a new logical standby database (single-instance only)
Add an existing (physical or logical) standby database (single-instance or RAC)
You will need to connect to the primary database using SYSDBA credentials, if you haven't already.
|
See Also: Oracle Data Guard Concepts and Administration for the steps about how to create a RAC standby database |
Figure 5-4 show the introductory page of the create configuration process.
Figure 5-4 Add Standby Database Wizard - Introductory Page
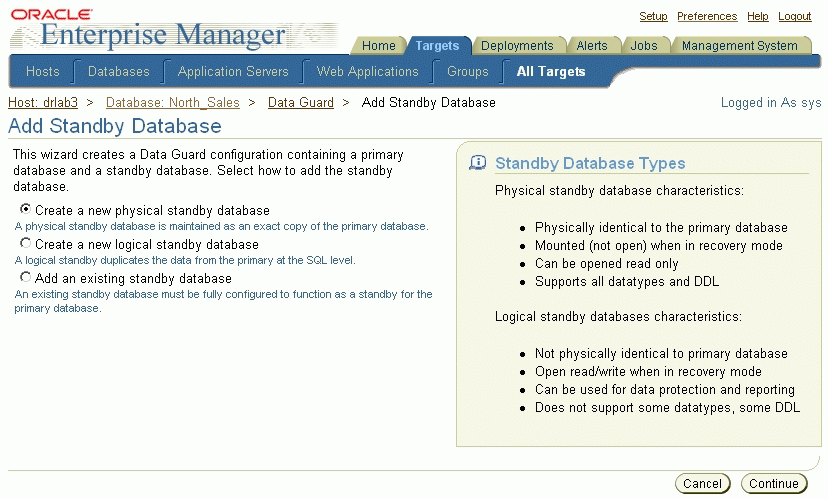
The Add Standby Database wizard takes you through the following steps:
The following steps create a broker configuration and create a new physical standby database. It shows how the wizard takes you through additional steps to select the Oracle home for the database and to copy datafiles to the standby database.
Step 1 Determine the backup type.
The Data Guard GUI uses Oracle Recovery Manager (RMAN) to create a single-instance standby database from a new or existing backup of the primary database. You can select one of two backup operations to use for the standby database creation:
Perform a live backup of the primary database
Use an existing backup of the primary database
Figure 5-5 shows Step 1 of 6 of the configuration process if you are adding a physical standby database.
Figure 5-5 Add Standby Database Wizard - Backup Type (Physical Standby Database)
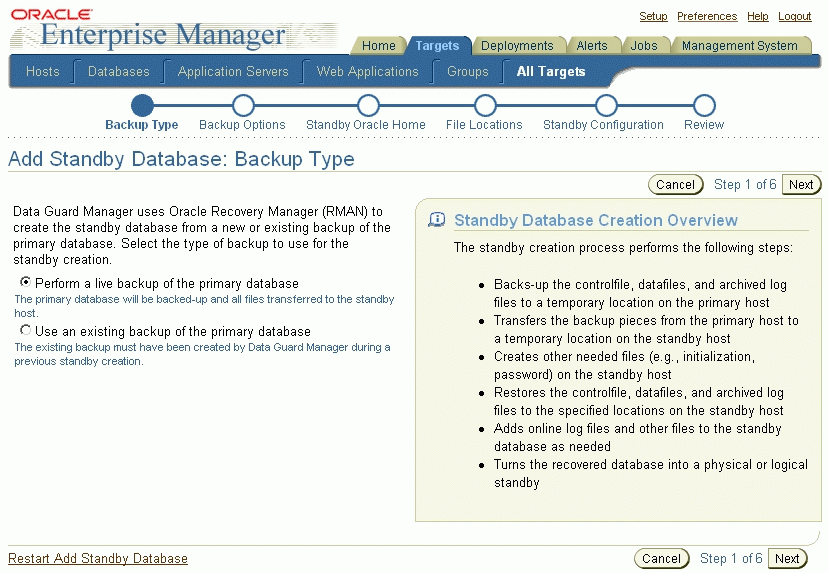
You can click Restart Add Standby Database to terminate the current process and begin again at the introductory page of the Add Standby Database wizard.
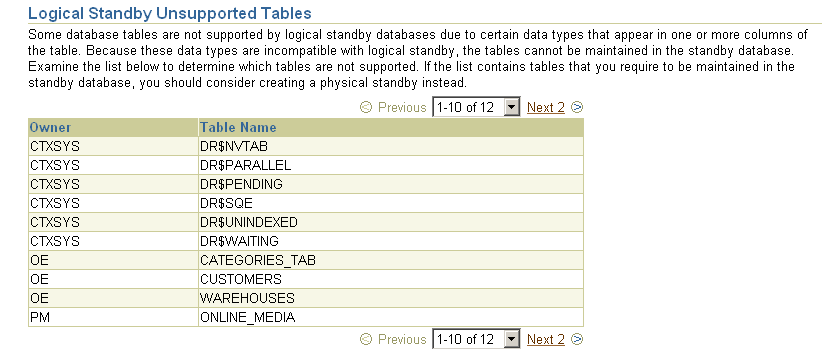
Figure 5-6 shows additional screen content that appears if you are adding a logical standby database.
Figure 5-6 Add Standby Database Wizard - Backup Type (Logical Standby Database)
Step 2 Set up the backup options.
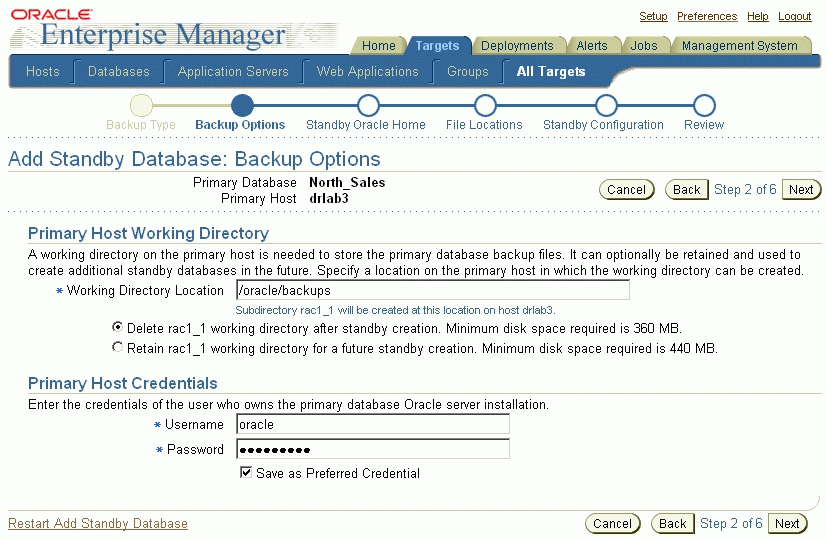
A working directory is needed to store the primary database backup files. It can optionally be retained and used to create additional standby databases in the future. Specify a location on the primary host in which the working directory can be created.
Primary host credentials are required for this step. Enter the credentials of the owner of the primary database Oracle server installation. These credentials can be saved by checking the box marked Save as Preferred Credential.
You can click Restart Add Standby Database to terminate the current process and begin again at the introductory page of the Add Standby Database wizard.
Figure 5-7 shows Step 2 of 6 of the configuration process.
Figure 5-7 Add Standby Database Wizard - Backup Options
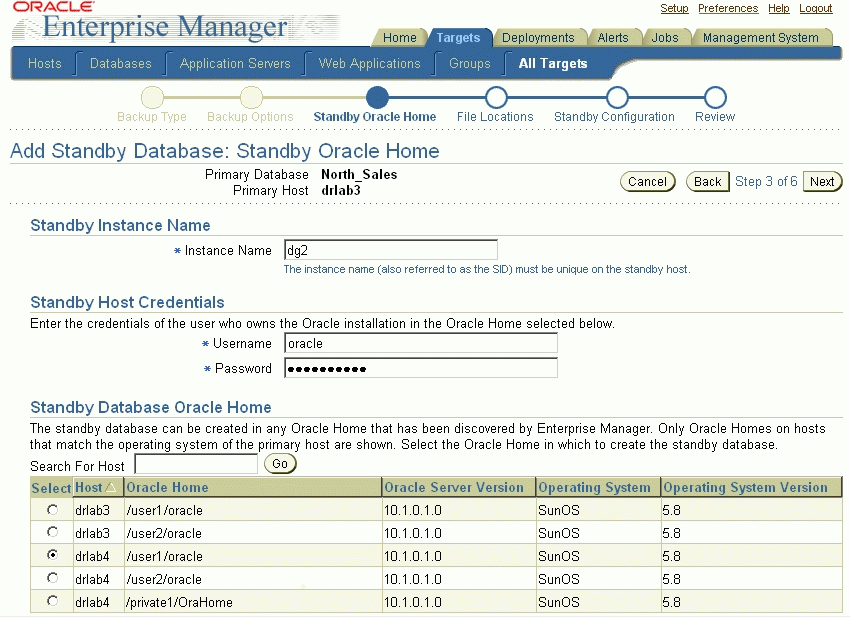
Step 3 Select the Oracle home in which to create the standby database.
The standby database can be created in any Oracle home that was discovered by Oracle Enterprise Manager. Only Oracle homes on hosts that match the operating system of the primary host are shown. You must select a discovered Oracle home and provide a unique instance name for the standby database. Standby host credentials are required to continue.
Figure 5-8 shows Step 3 of 6 of the configuration process.
Figure 5-8 Add Standby Database Wizard - Standby Oracle Home
Step 4 Set up the location for standby database files.
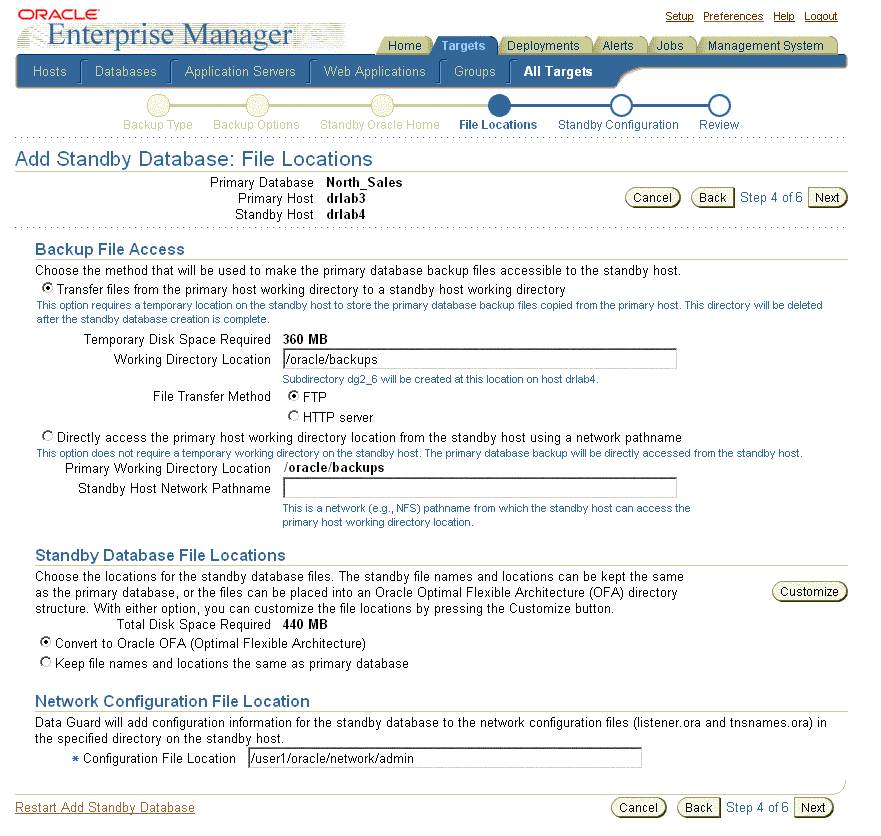
Part of the create broker configuration process involves making the datafiles for the primary database available to the standby host. You have the option of customizing the location for the standby database files. Standby host credentials are required to continue. The following list describes your options:
Specify the backup file access method
Choose the method by which you want to make the primary database backup files accessible to the standby host. The two options are:
Transfer files from the primary host working directory to a standby host working directory
Directly access the primary host working directory location from the standby host using a network path name
Specify the standby database file location
Choose the locations for the standby database files. You have two options:
Convert to Oracle OFA (Optimal Flexible Architecture)
Keep file names and locations the same as the primary database
Specify the network configuration file location
Data Guard will add configuration information for the standby database to the network configuration files (listener.ora and tnsnames.ora) in the specified directory on the standby host.
You can click Restart Add Standby Database to terminate the current process and begin again at the introductory page of the Add Standby Database wizard.
Figure 5-9 shows Step 4 of 6 of the configuration process.
Figure 5-9 Add Standby Database Wizard - File Locations
Step 5 Provide standby database configuration parameters.
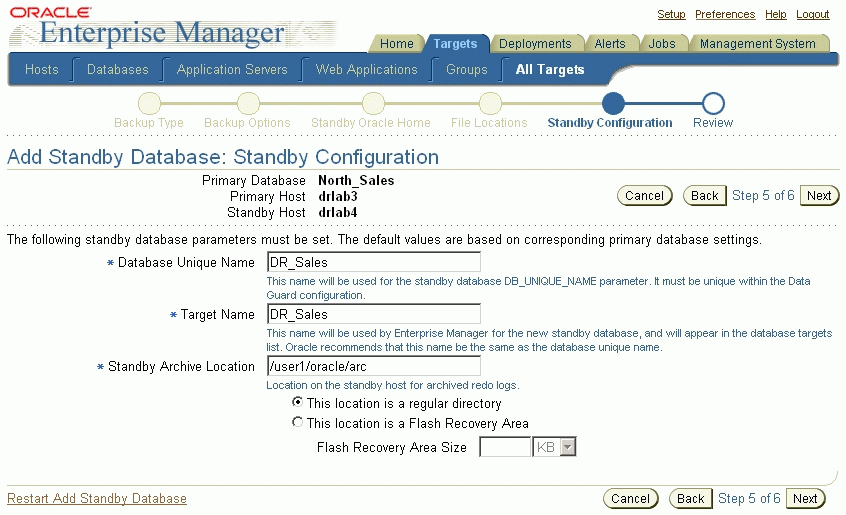
Standby database configuration parameters must be set. These parameters include the instance name (SID), database unique name, target name, and standby archive location. The standby archive location can be a regular directory or a flash recovery area. The default values are based on corresponding primary database settings.
You can click Restart Add Standby Database to terminate the current process and begin again at the introductory page of the Add Standby Database wizard.
Figure 5-10 shows Step 5 of 6 of the configuration process.
Figure 5-10 Add Standby Database Wizard - Standby Configuration
Step 6 Review the information before clicking Finish.
The Add Standby Database wizard allows one last review of the data you input for the configuration and standby database. Click Finish when you are certain all of the information is correct.
You can click Restart Add Standby Database to terminate the current process and begin again at the introductory page of the Add Standby Database wizard.
Figure 5-11 shows Step 6 of 6 of the configuration process.
By clicking Standby Database File Locations, you can see additional information about all the standby database file locations.
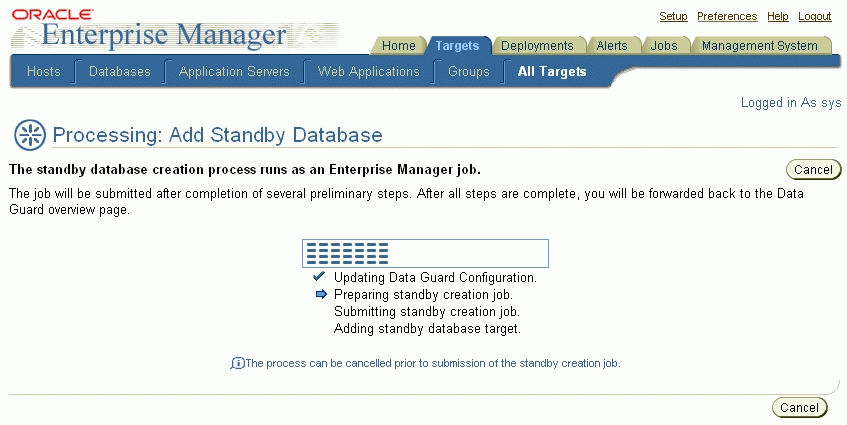
Once you click Finish, the standby database creation process runs as an Oracle Enterprise Manager job. You can cancel the standby creation at any point before the job submission. Figure 5-12 shows the standby database creation process.
Figure 5-12 Add Standby Database Wizard - Processing
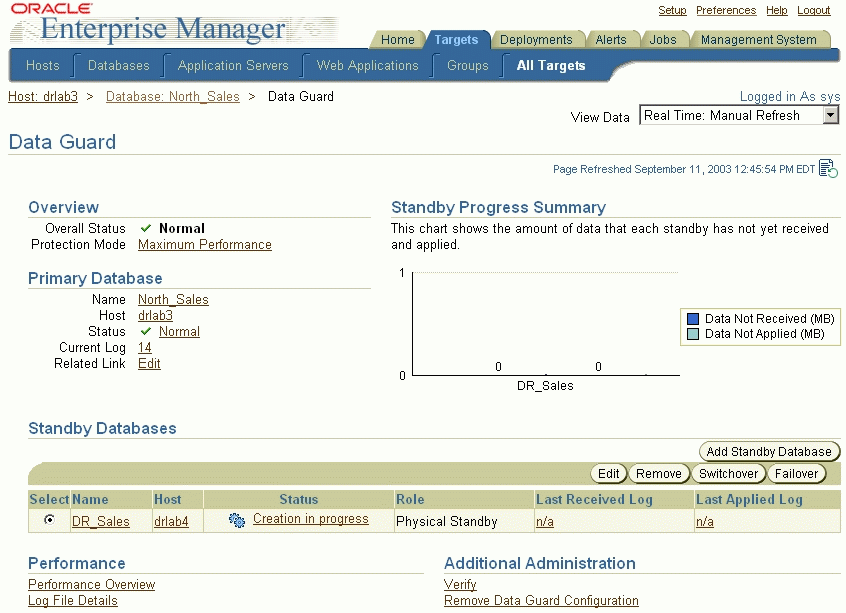
After the job is submitted, you will be returned to the Data Guard Overview page. In the Status column of the Standby Databases table, you will see Creation in progress listed. If you click that link, you can monitor the progress of the standby database creation. Figure 5-13 shows the Data Guard Overview page with this link.
To add additional standby databases after the initial creation of the configuration, click Add Standby Database to run the Add Standby Database wizard again.
Figure 5-13 Data Guard Overview Page - Creation in Progress
Although the Add Standby Database wizard will not create a RAC standby database, you can add an existing RAC standby database into a Data Guard configuration. Click Add Standby Database to run the Add Standby Database wizard and select Add an existing standby database.
Figure 5-14 shows the Add Standby Database introductory page.
Figure 5-14 Adding an Existing RAC Standby Database to the Data Guard Configuration
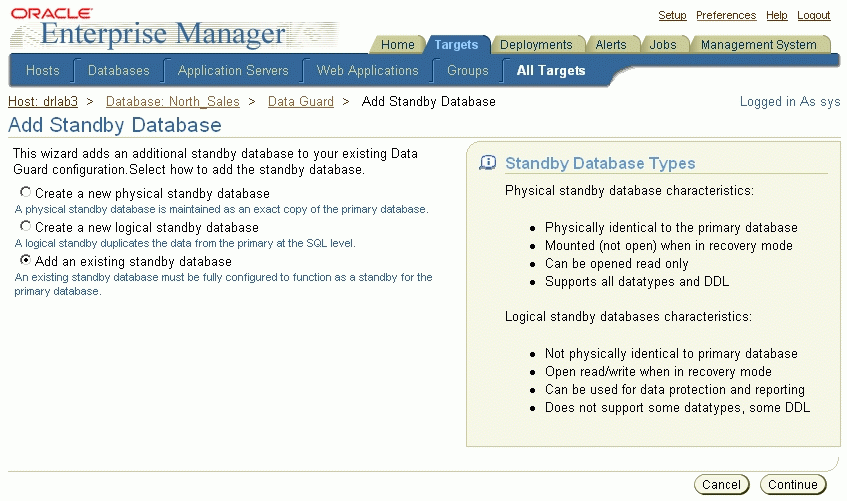
The Add Standby Database wizard takes you through the following steps:
Step 1 Select an existing standby database.
In this step, select the RAC standby database you want to add to the configuration. All discovered databases in your environment (both RAC and non-RAC databases) will be shown in the list. In the example shown in Figure 5-15 (Step 1 of 3), one of the databases in the list (RAC10g) is a RAC standby database.
You can click Restart Add Standby Database to terminate the current process and begin again at the introductory page of the Add Standby Database wizard.
If you wish to continue, click Next.
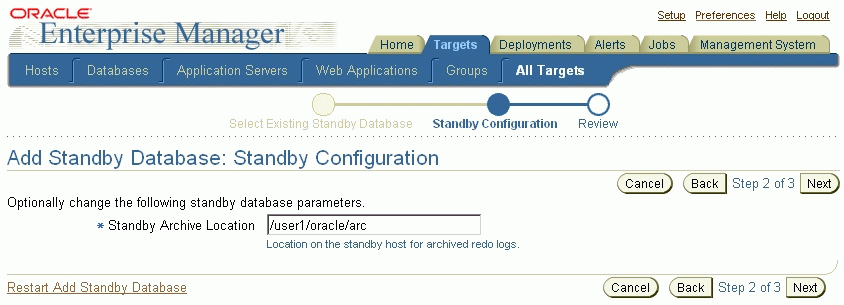
Step 2 Set the standby archive location setting.
You can optionally change the Standby Archive Location setting of the existing standby cluster database, as shown in Figure 5-16 (Step 2 of 3).
You can click Restart Add Standby Database to terminate the current process and begin again at the introductory page of the Add Standby Database wizard.
If you wish to continue, click Next.
Figure 5-16 Add Standby Database: Standby Configuration
Step 3 Review the configuration settings.
Review the data for the configuration and standby database, as shown in Figure 5-17 (Step 3 of 3).
You can click Restart Add Standby Database to terminate the current process and begin again at the introductory page of the Add Standby Database wizard.
If you wish to complete the operation, click Finish.
The Data Guard GUI can help simplify some of the routine maintenance tasks you must perform in the configuration. The following examples, provided in the following sections, show:
This section describes how to set the standby database to Log Apply Off.
To change the state of the standby database to Log Apply Off, follow these steps:
From the Data Guard Overview page, select the standby database you want to change to the Log Apply Off state.
Click Edit to go to the Edit Properties page.
Select Log Apply Off.
Click Apply.
When the process completes, a message indicating success is returned.
Figure 5-18 shows the Edit Properties page from where you can change the state of a database.
Figure 5-18 Changing the State or Properties of a Database
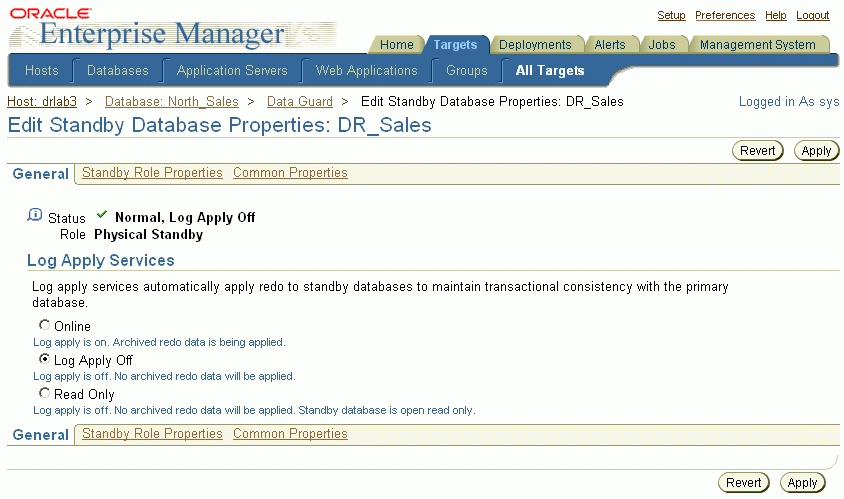
When you change the state of the standby database to Log Apply Off, it stops log apply services from applying the archived redo log files to the standby database. However, log transport services are unaffected.
After completing your maintenance tasks, you can follow the same sequence of steps to bring the database online again.
The Data Guard GUI divides the database properties into primary, standby, and common properties.
To view or change properties:
Click either Edit from the Primary Database section or click Edit from the Standby Databases section of the Data Guard Overview page.
Click one of the following:
Standby Role Properties
Common Properties
Make the appropriate change and click Apply.
When the process completes, a message indicating success is returned.
Figure 5-18 shows the Edit Properties page from where you can alter a property of a database.
Figure 5-19 shows properties specific to the standby database.
By clicking Show Advanced Properties, you can view additional properties specific to the standby database, as shown in Figure 5-20.
Figure 5-21 shows properties common to both the primary database and the standby database.
You can change the broker configuration's overall protection mode with the Data Guard GUI.
When the configuration was first created it was placed in the maximum performance mode by default. This section describes the process for upgrading to the maximum protection mode. The maximum protection mode guarantees that no data loss will occur if the primary database fails.
To set the maximum protection mode:
Click Maximum Performance under the Overview section on the Data Guard Overview page.
Select Maximum Protection and click Continue.
Figure 5-22 shows the Edit Protection Mode page.
Select one or more of the standby databases listed in Figure 5-23 that you want to support the maximum protection mode. The log transport mode (and LogXptMode property) will automatically be set to SYNC for the primary database and the selected standby databases.
Data Guard broker automatically determines the correct number and size of standby redo log files needed for all databases in the configuration and adds those log files using the directory locations you specify. Click OK to continue.
Figure 5-23 Edit Protection Mode - Standby Databases and Online Redo Log Files
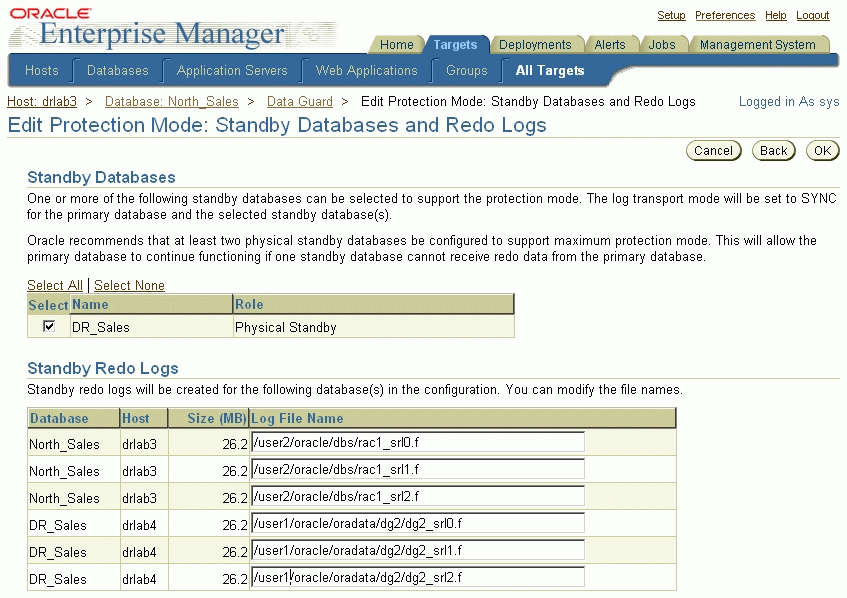
Confirm that you want to change the protection mode. Click Yes to continue or No to cancel. Figure 5-24 shows this confirmation page.
Once the protection mode is successfully updated, the Data Guard Overview page is displayed as shown in Figure 5-25.
There may be occasions when you might want to perform a switchover between the primary database and standby databases. This scenario steps you through the process of using the switchover operation to switch roles between the primary database and a standby database.
To execute a switchover, perform the following steps:
Select the standby database that you want to become the primary database.
Click Switchover.
Click Yes to continue with the switchover. Click No to cancel.
Figure 5-26 shows the Switchover Confirmation page.
The Switchover operation performs the following steps:
Ensures that the primary database and standby database are not currently in an error status condition and verifies that broker management of the primary database is enabled and online.
If the switchover target is a physical standby database, you can view any active user sessions connected to the primary using the Browse Primary Database Sessions link. These sessions will be closed automatically during the switchover.
Performs the switchover by first changing the primary database to the standby role, and then the standby database to the primary role, displaying a progress indicator as the switchover progresses.
If the switchover target is a physical standby database, both it and the primary database will be restarted.
Figure 5-27 shows the Processing page during the switchover.
Figure 5-28 shows the Data Guard Overview page after a successful switchover.
Figure 5-28 New Primary Database After Switchover
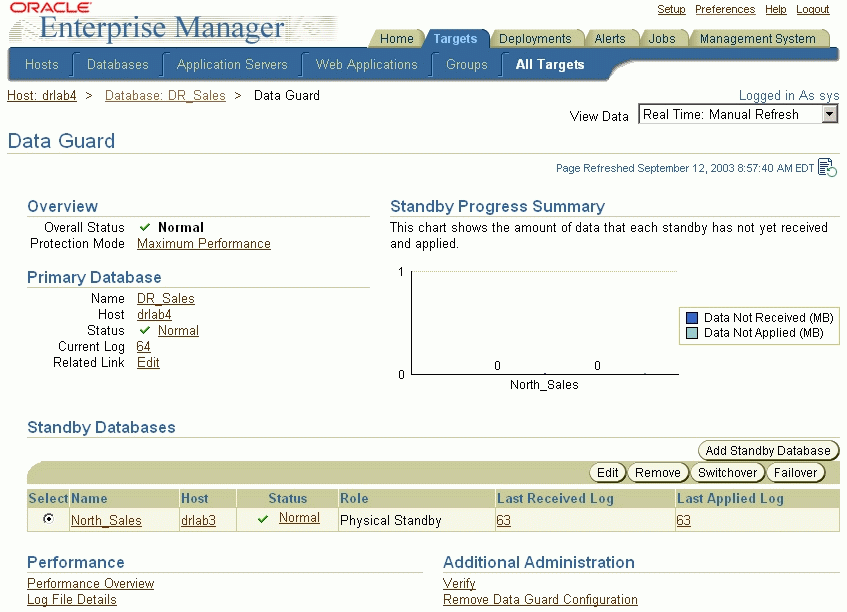
This scenario steps you through the process of using the Failover operation to transition one of the physical standby databases, in this case DR_Sales, into the primary role. You should perform a failover only in the event of a software or system failure that results in the loss of the primary database. The failed primary database is disabled by the broker and must be re-created, and the standby database assumes the primary database role. See Section 4.2.5 for steps to re-create the failed primary database as a standby database to the new primary database.
In Figure 5-29 the Data Guard Overview page shows the ORA-16625 error status that indicates problems accessing the primary database.
Figure 5-29 Data Guard Overview Page Showing ORA-16625 Error
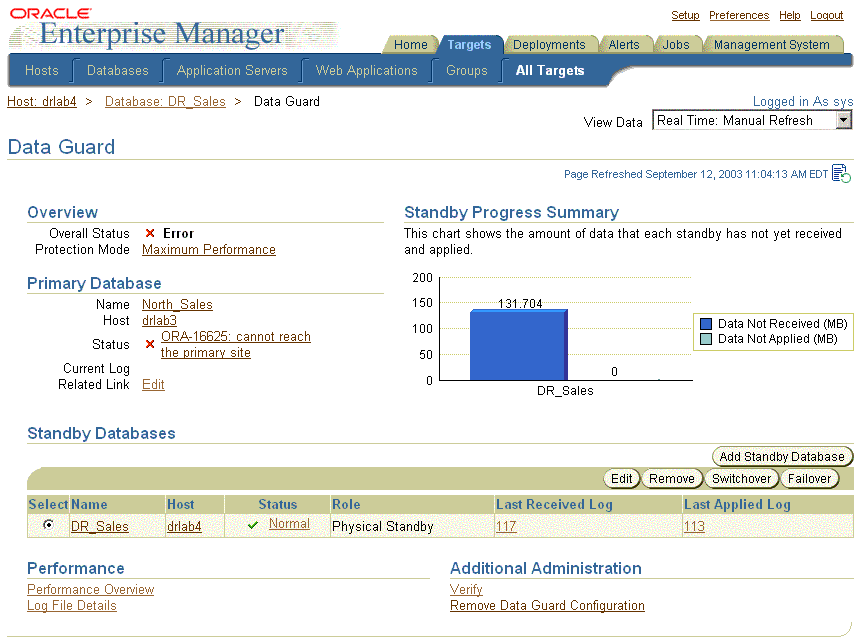
To transition DR_Sales into the primary role, select DR_Sales in the Standby Databases table and click Failover. Figure 5-30 shows the Failover Confirmation page.
If you determine that a failure occurred on the primary database and there is no possibility of recovering the primary database in a timely manner, you can start the Failover operation. Oracle recommends that you choose a physical standby database (instead of a logical standby database) as the target of a failover.
The Failover operation enables you to choose one of the following two types of failover operations:
Complete—attempts to minimize data loss by applying all available redo on the standby database.
Immediate—no additional data will be applied on the standby database; data may be lost. This is the fastest type of failover.
Figure 5-31 shows the progress of the failover operation.
During the failover, the selected standby database transitions into the primary role. If the failover target is a physical standby database, it is restarted. When completed, the Data Guard Overview page reflects the updated configuration, as shown in Figure 5-32.
Figure 5-32 Data Guard Overview Page After a Failover Operation Completes
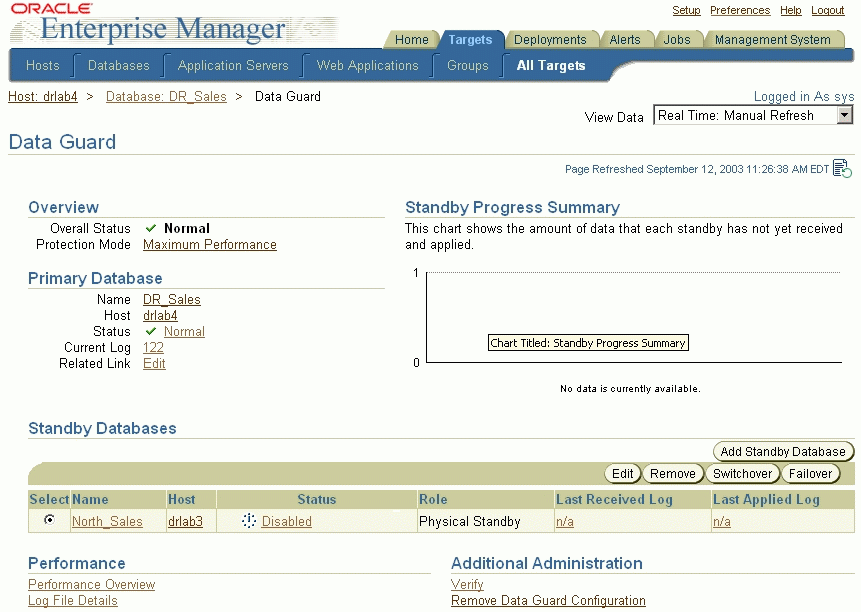
In the figure, the Status column indicates that the original primary database (North_Sales) is disabled and can no longer be managed through the Data Guard GUI until it has been re-created.
The Data Guard GUI provides ways to monitor the status of a configuration as well as the online redo log file activity of the primary and standby databases. At the most basic level, the Data Guard Overview page for the configuration not only displays information about the configuration, but it also includes summary information about its databases.
|
Note: You can access the monitoring functions of Data Guard even if you are logged in as a non-SYSDBA user. However, all management features, such as standby creation, switchover, and failover, require a SYSDBA connection. |
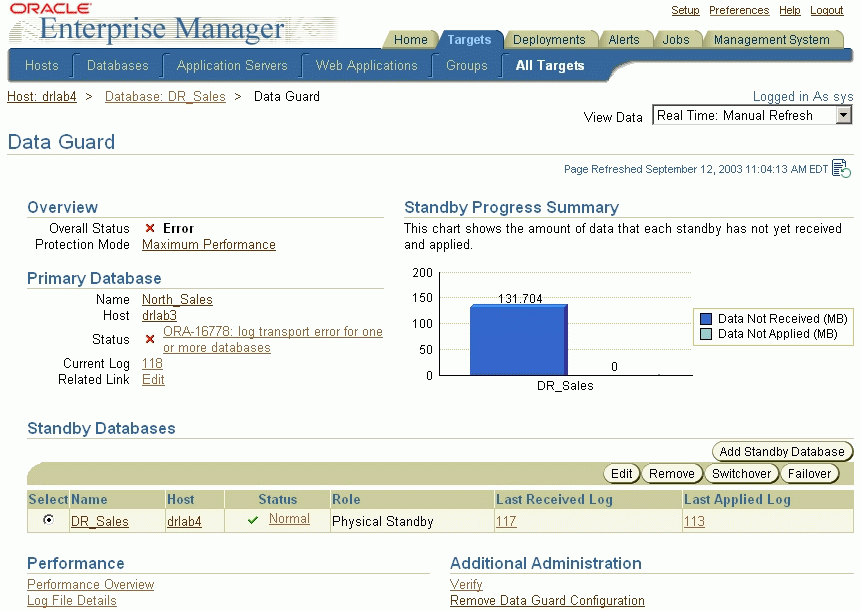
For example, the summary information on the Data Guard Overview page shows the status for all of the databases in the configuration. If you want more information about why log apply services are off for a specific standby database, select the Status link of the database in the Standby Databases table and view the property pages. Any Data Guard specific database properties that are incorrect, inconsistent, or known to be in conflict with other parameters will be flagged with a warning in the Edit Properties page for the database. A variety of icons indicating the status condition can appear next to the Status link. A green check mark appears if the primary database is functioning normally; a yellow triangle containing an exclamation mark appears if there is a warning; and a red X appears if there is an error condition.
To check the primary database status, select Status under the Primary Database section of the Data Guard Overview page.
To check the status of a standby database listed in the Standby Databases table, select the link under the Status column.
For example, a yellow warning icon may display the message "A yellow warning indicates an inconsistent property has been detected. The value for this property is inconsistent between Data Guard and the database, Data Guard and the server parameter file, or Data Guard and both the database and server parameter file."
Figure 5-33 shows the Data Guard Overview page in the case where the configuration has a log transport error.
Figure 5-33 Data Guard Overview Page Showing Log Transport Error
The following sections provide information on ways to monitor the status and health of a configuration:
Another way to quickly check the overall health of a broker configuration is to run the Verify operation. The Verify operation performs a series of validation checks on the broker configuration, including a health check of each database in the configuration. The checks include:
Shows the current data protection mode setting, including the current log transport mode settings for each database and whether or not the standby redo log files are configured properly. If standby redo log files are needed for any database, the Verify results will allow you to automatically configure them.
Validates each database for the current status.
Performs a log switch on the primary database and then verifies that the log file was applied on each standby database.
Shows the results of the Verify operation, including errors, if any. The Verify operation completes successfully if there are no errors and an online redo log file was successfully applied to at least one standby database.
Shows any databases or RAC instances that are not discovered. Undiscovered databases and instances could prevent a failover or switchover from completing successfully.
Detects inconsistencies between database properties and their corresponding values in the database itself. It also provides a mechanism for resolving these inconsistencies.
|
Note: You can click Cancel at any time to stop the Verify operation. |
To verify the configuration, click Verify under the Additional Administration section of the Data Guard Overview page. See Figure 5-34. The Verify command displays a progress indicator. When the Verify operation completes successfully, the broker configuration is healthy, guarding the data, and ready for a switchover or failover.
Figure 5-35 shows the results of running the Verify operation.
For each standby database in the configuration, there is a table that shows the status of archived redo log files that were generated on the primary database but not received by the standby database, and for archived redo log files that were received but not applied to the standby database. This Log File Details page is useful to determine log file information when log transport or log apply services are stopped. Under normal operations, each standby table is empty.
For example, if log transport services go offline unexpectedly, the primary database continues to generate archived redo log files, but log transport services will not send the archived redo log files to the standby databases. You can view the Log File Details page to find out which log files have not yet been received for each standby database.
On the Log File Details page, there is a Primary Current Log entry that indicates the log sequence number of the current log file on the primary.
For each standby database, log transport and log apply information is displayed to help diagnose any log file buildup. Table 5-1 describes the columns for the standby table:
Table 5-1 Log File Details Page
| Column Title | Description |
|---|---|
| Log | The log sequence number. |
| Status | The status of the log file. |
| Not Received | The log file has not been received. |
| Not Applied | The log file has not been applied. |
| First Change # (SCN) | The first system change number. |
| Last Change # (SCN) | The last system change number. |
| Size (KB) | The size, in kilobytes, of the log file. |
| Time Generated | The time when the log file was generated. |
| Time Completed | The time at which the log file was completed. |
Click Log File Details from the Data Guard Overview page to see the page shown in Figure 5-36.
For more in-depth performance and monitoring, you can display detailed performance statistics for a broker configuration using performance charts that provide a graphical summary of all online redo log file activity in the configuration. The charts are refreshed based on a collection interval (the rate at which data is sampled from the primary database) that you can specify. The default collection interval is 30 seconds, which can be changed. See the online Help for detailed information about performance sampling rates.
For example, Figure 5-37 shows performance information for all of the objects in the configuration.
The Performance Overview page begins charting information as soon as the page is displayed. Data will not be collected for any offline or disabled databases.
In addition to monitoring the status and log file activity using the Data Guard GUI, Oracle Enterprise Manager automatically monitors the status and archived redo log file activity on the primary and standby databases.
Table 5-2 describes the five Data Guard metrics.
Table 5-2 Data Guard Metrics
| Metric | Description |
|---|---|
| Data Guard Status | Checks the status of each database in the broker configuration. |
| Data Not Applied (MB)Foot 1 | Measures the difference (in megabytes) between the last log file received and the last log file applied on each standby database. |
| Data Not Applied (log files) | Measures the difference (in number of archived redo log files) between the last log file received and the last log file applied on each standby database. |
| Data Not Received (MB)Footref 1 | Measures the difference (in megabytes) between the current log file on the primary database and the last log file received on each standby database. |
| Data Not Received (log files) | Measures the difference (in number of archived redo log files) between the current log file on the primary database and the last log file received on each standby database. |
You can set up Email Services to notify you through your e-mail if any of the metrics are triggered.
|
See Also: Oracle Enterprise Manager help and documentation for more information about registering metrics and using Email Services |
The following sections provide additional information about the Data Guard metrics.
The Data Guard Status metric checks the status of each database in the broker configuration and triggers a warning or critical alert if necessary.
The broker computes the highest applied SCN and uses its value to find the last continuous log that was successfully archived to the standby database. The size of redo data in all subsequent log files are counted as data not applied. If the primary database goes down at this point, these logs can be applied on the standby database. If there is a gap in the logs received on the standby database, any logs received after the gap cannot be applied. See the Oracle Data Guard Concepts and Administration for information about archive gaps.
For example, if logs 1, 2, 3, 6, 7, and 9 are received on the standby database and log apply services is currently applying log 1, log apply services can continue to apply up to log 3. Log apply services cannot apply any more logs because log 4 is missing. Even though logs 6, 7, and 9 are received, they cannot be applied and they will not be counted as data not applied. In this case, the total size of logs 1, 2, and 3 is the size of Data Not Applied.
If all the archived log files on the standby database are continuous, and standby redo logs are used, the standby redo logs are also counted as data not applied, unless real-time apply is turned on and log apply services is already working on the standby redo logs. The size of an archived log file is its file size. However, the size of a standby redo log is the size of the actual redo in the log and not the file size.
If the standby redo logs are multithreaded, the broker computes the highest applied SCN for every thread and totals the numbers. If there are multiple incarnations and the standby database is in a different incarnation from the primary database, each incarnation is computed separately and the results are then totaled.
The broker computes the highest applied SCN and uses its value to find the last continuous log that was successfully archived to the standby database. Redo data in all subsequent log files are counted as logs not applied. If the primary database goes down at this point, these logs can be applied on the standby database. If there is a gap in the logs received on the standby database, any logs received after the gap cannot be applied. See the Oracle Data Guard Concepts and Administration for information about archive gaps.
For example, if logs 1, 2, 3, 6, 7, and 9 are received on the standby database and log apply services is currently applying log 1, log apply services can continue to apply up to log 3. Log apply services cannot apply any more logs because log 4 is missing. Even though logs 6, 7, and 9 are received, they cannot be applied and they will not be counted as data not applied.
If all the archived log files on the standby database are continuous, and standby redo logs are used, the standby redo logs are also counted as data not applied, unless real-time apply is turned on and log apply services is already working on the standby redo logs.
If the standby redo logs are multithreaded, the broker computes the highest applied SCN for every thread and totals the numbers. If there are multiple incarnations and the standby database is in a different incarnation from the primary database, each incarnation is computed separately and the results are then totaled.
The broker computes the highest applied SCN and uses its value to find the last continuous log that was successfully archived to the standby database. The size of redo data in all subsequent log files, including the current online redo log file, are counted as data for potential data loss and will be unrecoverable if the primary database goes down at this point. The size of an archived log file is its file size, and the size of the online redo log file is the size of the actual redo in the online log, not the file size of the online redo log file.
For example, if logs 1, 2, 3, 6, 7, and 9 are received on the standby database, and if log 10 is the current online log file, and if log apply services is currently applying log 1, the last continuous log after the highest applied SCN is log 3. All logs after log 3, that is logs 4 through 10, are counted as data not received and the total size of redo data in these logs is the size of Data Not Received.
If the primary database is multithreaded (in a RAC database), the broker computes the highest applied SCN for every thread and totals the numbers. If the primary database has multiple incarnations (for example, due to a flashback operation) and the standby database is in a different incarnation from the primary database, the computation is done on each incarnation and the results are then totaled.
The broker computes the highest applied SCN and uses its value to find the last continuous log that was successfully archived to the standby database. Redo data in all subsequent log files, including the current online redo log file, are counted as logs for potential data loss and will be unrecoverable if the primary database goes down at this point.
For example, if logs 1, 2, 3, 6, 7, and 9 are received on the standby database, and if log 10 is the current online log file, and if log apply services is currently applying log 1, the last continuous log after the highest applied SCN is log 3. All logs after log 3, that is logs 4 through 10, are counted as data not received. If the primary database goes down at this point, all redo data in logs 4 through 10 are lost on the standby database.
If the primary database is multithreaded (in a RAC database), the broker computes the highest applied SCN for every thread and totals the numbers. If the primary database has multiple incarnations (for example, due to a flashback operation) and the standby database is in a different incarnation from the primary database, the computation is done on each incarnation and the results are then totaled.
The example in this section describes Data Guard metrics and how to set up for notification through e-mail when a metric is triggered. Take the following steps to manage Data Guard metrics:
Step 1 Set up to receive metric notification by e-mail.
You can set up the Notification Methods to notify you through e-mail if any of the metrics are triggered. To set up Notification Methods, take the following steps:
Click Setup at the bottom of the Database Home page.
Click Notification Methods on the Setup page.
Set up the required mail server information.
|
See Also: Oracle Enterprise Manager documentation and help for a complete description of Email Services |
Step 2 View the All Metrics page.
You can view all of the metrics for Oracle Enterprise Manager, including Data Guard, by clicking All Metrics at the bottom of the Database Home page.
Figure 5-38 shows the All Metrics page for the primary database with the Data Guard metrics expanded.
Step 3 Set or change metric thresholds for Data Guard thresholds.
There are five metrics for Data Guard. These metrics can be changed from the Manage Metrics page.
Data Guard Status
If the Data Guard Status metric contains Warning, a warning alert is triggered. If the metric contains Error, a critical alert is triggered.
Data Not Applied (MB)
There is no default value. If you want to receive alerts for these metrics, you need to set these thresholds from the Manage Metrics link from the bottom of the Database Home page.
Data Not Applied (log files)
The default values for log files are 1 for the warning threshold and 3 for the critical threshold. If the number of log files is greater than 1, a warning alert is triggered. If the number of log files is greater than 3, a critical alert is triggered. You can change these values from the Manage Metrics link from the bottom of the Database Home page.
Data Not Received (MB)
There is no default value. If you want to receive alerts for these metrics, you need to set these thresholds from the Manage Metrics link from the bottom of the Database Home page.
Data Not Received (log files)
The default values for log files are 1 for the warning threshold and 3 for the critical threshold. If the number of log files is greater than 1, a warning alert is triggered. If the number of log files is greater than 3, a critical alert is triggered. You can change these values from the Manage Metrics link from the bottom of the Database Home page.
Step 4 View triggered metrics.
If a metric condition is triggered or a threshold value is exceeded, an alert is issued. Click Data Guard from the All Metrics page to view triggered metrics.
Figure 5-39 is an example of what is shown when the Data Guard Status metric triggers after a log transport error is detected in the configuration. The table shows the status of each database in the configuration. The status of the primary database shows the ORA-16778 error.
Because Email Services was set up, DBAs are also notified by an e-mail message.
After a metric condition is fixed, the metric is cleared automatically.
You can remove a standby database or broker configuration so that it is no longer controlled by the Data Guard broker.
Removing a standby database from Data Guard broker control does not permanently delete the database itself. This operation permanently removes the profile of the standby database from the broker configuration file.
By default, the standby destination is also removed from the primary database so that log files are no longer archived to that standby database.
|
Caution: The Oracle9i Data Guard Manager default was to preserve the standby destination on the primary database. |
To remove a standby database from the broker configuration, click Remove in the Standby Databases section of the Data Guard Overview page. Data Guard GUI will ask you to confirm that you really want to remove the standby database from the configuration. Click Yes to continue or No to cancel.
Figure 5-40 shows removing a standby database.
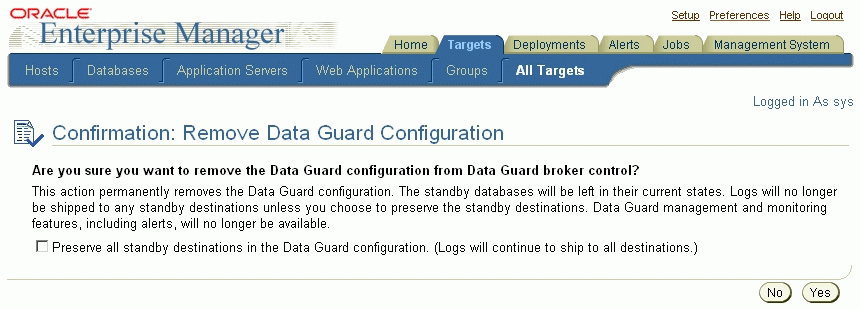
To remove the broker configuration, you must be connected to the configuration through the primary database. Click Remove Data Guard Configuration under the Additional Administration section. The Data Guard GUI will ask you to confirm that you want to remove the configuration. Click Yes to continue or No to cancel.
Figure 5-41 shows removing a Data Guard broker configuration.
Figure 5-41 Removing a Data Guard Broker Configuration
When you choose this option, the Data Guard GUI removes (deletes) the selected broker configuration permanently. When you permanently remove a configuration, the remove operation:
Does not affect the underlying operations of the standby databases or log apply services if you check the box to preserve all standby destinations. Operations such as log transport services and log apply services continue to run; however, these services are no longer manageable through the Data Guard GUI.
By default, all standby database profiles are removed from the broker configuration, and log transport services to all standby databases in the configuration are stopped.
Destroys all broker configuration profile information maintained for each database; the configuration is then unknown to the broker and can no longer be managed from the Data Guard GUI.
Although the configuration information is not recoverable once you delete a broker configuration permanently, you can easily re-create the configuration with the Add Standby Database wizard.