| Oracle® Database 2 Day + Performance Tuning Guide 11g Release 1 (11.1) Part Number B28275-01 |
|
|
View PDF |
| Oracle® Database 2 Day + Performance Tuning Guide 11g Release 1 (11.1) Part Number B28275-01 |
|
|
View PDF |
System changes, such as upgrading a database or adding an index, may cause changes to execution plans of SQL statements, resulting in a significant impact on SQL performance. In some cases, the system changes may cause SQL statements to regress, resulting in performance degradation. In other cases, the system changes may improve SQL performance. Being able to accurately forecast the potential impact of system changes on SQL performance enables you to tune the system beforehand in cases where the SQL statements regress, or to validate and measure the performance gain in cases where the performance of the SQL statements improves.
SQL Performance Analyzer enables you to forecast the impact of system changes on a SQL workload by:
Measuring the performance before and after the change
Generating a report that describes the change in performance
Identifying the SQL statements that regressed or improved
Providing tuning recommendations for each SQL statement that regressed
Enabling you to implement the tuning recommendations when appropriate
This chapter contains the following sections:
See Also:
Oracle Database Performance Tuning Guide to learn how to run SQL Performance Analyzer with the DBMS_SQLPA package
You can use SQL Performance Analyzer to analyze the SQL performance impact of any type of system changes. Examples of system changes include the following:
Database upgrade
When performing a database upgrade, you may not be able to predict how the system will perform after the upgrade, or if an existing functionality may be adversely affected. For example, a database upgrade installs a new version of the optimizer, which has an effect on SQL performance. SQL Performance Analyzer enables you to compare the SQL performance between two versions of Oracle Database. In this way, you can identify and tune SQL statements that may potentially regress after the database upgrade without affecting your production system.
Application upgrade
An application upgrade may involve changes to the database, such as redesigning tables, or adding and removing indexes. As is the case with database upgrades, it is difficult to predict how the system will perform after the changes, or if an existing functionality may be adversely affected. SQL Performance Analyzer enables you to compare the SQL performance between two versions of an application. Thus, you can tune SQL statements that may potentially regress after the upgrade.
Changes to the operating system, hardware, and database configuration
Changes to the operating systems (such as installing a new operating system), hardware (such as adding more CPU or memory), or database configuration (such as moving from a single instance database environment to Oracle Real Application Clusters) may have a significant effect on SQL performance. SQL Performance Analyzer enables you to determine the improvement or deterioration to SQL performance when making these changes.
Schema change
Changing a schema, such as altering indexes or creating new ones, almost inevitably affects SQL performance. SQL Performance Analyzer enables you to determine the effect on SQL performance when making a schema change.
Database initialization parameter change
Changing the value of a database parameter may produce unexpected results. For example, you may enable a specific initialization parameter to improve performance, but this change may produce unexpected results because the system constraints may have changed. SQL Performance Analyzer enables you to determine the effect on SQL performance when changing a database initialization parameter.
SQL tuning
Accepting recommendations from an advisor (such as ADDM, SQL Tuning Advisor, or SQL Access Advisor) may require you to tune problematic SQL statements. For example, SQL Tuning Advisor may recommend that you accept a SQL profile for a particular SQL statement. SQL Performance Analyzer enables you to measure the performance improvement that may be gained by tuning SQL statements as recommended by the advisors, and determine whether to accept these recommendations.
You can run SQL Performance Analyzer on a test system that closely resembles the production system, or on the production system itself. Performing a SQL Performance Analyzer analysis is resource-intensive, so performing the analysis on the production system may cause significant performance degradation.
Any global changes made on the system to test the performance effect may also affect other users of the system. For smaller changes, such as adding or dropping an index, the effect on other users may be acceptable. However, for systemwide changes, such as a database upgrade, using a production system is not recommended and should be considered only if a test system is unavailable. If a separate test system is available, then running SQL Performance Analyzer on the test system enables you to test the effects of the changes without affecting the production system.
To ensure that SQL Performance Analyzer can accurately analyze the SQL performance impact, the test system should be as similar to the production system as possible. For these reasons, running SQL Performance Analyzer on a test system is recommended and is the methodology described here. If you choose to run SQL Performance Analyzer on the production system, then substitute the production system for the test system where applicable.
Analyzing the SQL performance effect of system changes using SQL Performance Analyzer is an iterative process that involves the following steps:
Capture the SQL workload that you want to analyze on the production system, as described in "Capturing and Transporting a SQL Workload".
Transport the SQL workload from the production system to the test system, as described in "Capturing and Transporting a SQL Workload".
Create a SQL Performance Analyzer task on the test system using the SQL workload as its input source, as described in "Following a Guided Workflow with SQL Performance Analyzer".
Set up the environment on the test system to match the production system as closely as possible, as described in "Establishing the Initial Environment".
Build the pre-change performance data by executing the SQL workload on the system before the change, as described in "Collecting SQL Performance Data Before the Change".
Perform the system change on the test system, as described in "Making the System Change".
Build the post-change performance data by executing the SQL workload on the system after the change, as described in "Collecting SQL Performance Data After the Change".
Compare and analyze the pre-change and post-change versions of performance data, as described in "Comparing SQL Performance Before and After the Change".
Generate and review a report to identify the SQL statements in the SQL workload that have improved, remain unchanged, or regressed after the system change.
Tune any regressed SQL statements that are identified, as described in Chapter 10, "Tuning SQL Statements".
Ensure that the performance of the tuned SQL statements is acceptable by repeating Step 5 through Step 10 until your performance goals are met.
This section contains the following topics:
Before running SQL Performance Analyzer, capture a set of SQL statements on the production system that represents the SQL workload that you intend to analyze and transport to the test system. The captured SQL statements should include the following information:
SQL text
Execution environment
SQL binds, which are bind values needed to execute a SQL statement and generate accurate execution statistics
Parsing schema under which a SQL statement can be compiled
Compilation environment, including initialization parameters under which a SQL statement is executed
Number of times a SQL statement was executed
You can store captured SQL statements in SQL Tuning Sets and use them as an input source for SQL Performance Analyzer. Capturing a SQL workload using a SQL Tuning Set enables you to do the following:
Store the SQL text and any necessary auxiliary information in a single, persistent database object
Populate, update, delete, and select captured SQL statements in the SQL Tuning Set
Load and merge content from various data sources, such as the Automatic Workload Repository (AWR) or the cursor cache
Export the SQL Tuning Set from the system where the SQL workload is captured and import it into another system
Reuse the SQL workload as an input source for other advisors, such as SQL Tuning Advisor and SQL Access Advisor
After you have captured the SQL workload into a SQL Tuning Set on the production system, you must transport it to the test system.
See Also:
Oracle Database Performance Tuning Guide for information about transporting SQL Tuning Sets
Depending on the system change that you intend to analyze, you must set up the database environment on the test system before and after performing the system change. Before the system change, set up the database environment on the test system to match the database environment in the production system as closely as possible. In this way, SQL Performance Analyzer can more accurately forecast the effect of the system change on SQL performance.
For example, to test how changing a database initialization parameter will affect SQL performance, complete the following steps:
Set the database initialization parameter on the test system to the same value as the production system.
Build the pre-change SQL performance data.
Set the database initialization parameter to the new value you want to test.
Build the post-change SQL performance data.
Compare the two sets of performance data.
Similarly, to test the performance effect of a database upgrade from release 10g to release 11g, perform the following tasks:
Install Oracle Database 11g on the test system.
Revert the OPTIMIZER_FEATURES_ENABLE initialization parameter to the database version on the production system.
Build the pre-change SQL performance data.
Set the OPTIMIZER_FEATURES_ENABLE initialization parameter to the database version to which you are upgrading.
Build the post-change SQL performance data.
Compare the two sets of performance data.
See Also:
Oracle Database Reference to learn about the OPTIMIZER_FEATURES_ENABLE initialization parameter
After the SQL workload is captured and transported to the test system, and the initial database environment is properly configured, execute the SQL workload to build the pre-change performance data before making the system change. Executing a SQL workload runs each of the SQL statements contained in the workload to completion. During execution, SQL Performance Analyzer generates execution plans and computes execution statistics for each SQL statement in the workload. After the pre-change performance data is built, you can perform the system change.
After performing the system change, execute the SQL workload again to build the post-change performance data. SQL Performance Analyzer generates execution plans and computes execution statistics for each SQL statement in the workload a second time, resulting in a new set of performance data that can be used to compare to the pre-change version of the performance data.
Depending on its size, executing a SQL workload can be resource-intensive and cause a significant performance impact. When executing a SQL workload, you can choose to generate execution plans only, without collecting execution statistics. This technique shortens the time to run the execution and lessens the effect on system resources, but the results of the comparison analysis may not be as accurate. If you are running SQL Performance Analyzer on the production system, then consider executing the SQL workload using a private session to avoid affecting the rest of the system.
SQL Performance Analyzer enables you to analyze the effects of environmental changes on execution of SQL statements in SQL Tuning Sets. As explained in "Managing SQL Tuning Sets", a SQL Tuning Set is a database object that includes one or more SQL statements along with their execution statistics and execution context. In addition to the performance analysis, SQL Performance Analyzer can invoke SQL Advisor and provide tuning recommendations.
SQL Performance Analyzer guides you through the SQL workload comparison by means of the following workflows:
Optimizer Upgrade Simulation
Use this workflow to simulate a database upgrade and measure its effect on a workload.
Parameter Change
Use this workflow to determine how a database initialization parameter change will affect SQL performance.
Guided Workflow
Use this workflow to compare the performance of SQL execution on different databases.
In each of the preceding workflows, you must create a SQL Performance Analyzer task. A task is a container for the results of SQL replay trials. A replay trial captures the execution performance of a SQL Tuning Set under specific environmental conditions.
To run SQL Performance Analyzer:
On the Database Home page, click Advisor Central.
The Advisor Central page appears.
Click SQL Performance Analyzer.
SQL Performance Analyzer page appears. A list of existing SQL Performance Analyzer tasks are displayed.
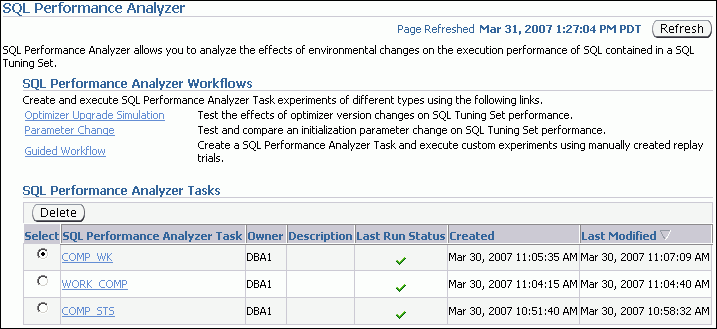
Do one of the following:
See Also:
Oracle Database Performance Tuning Guide for information about running SQL Performance Analyzer using APIs
SQL Performance Analyzer can automatically simulate the effect of a database upgrade on SQL performance. The simulation is based on changing the OPTIMIZER_FEATURES_ENABLE initialization parameter. All SQL statements use the optimizer, which is a part of Oracle Database that determines the most efficient means of accessing the specified data. You could use SQL Performance Analyzer to compare the performance of SQL execution when using the 10.2.0.2 and 11.1.0.1 versions of the optimizer.
After you select a SQL Tuning Set and a comparison metric, SQL Performance Analyzer creates two replay trials. The first trial captures SQL performance by simulating the optimizer from the user-selected previous release, whereas the second trial uses the optimizer from the current release. The system-generated Replay Trial Comparison report evaluates SQL regression. If performance was degraded, then you can then use SQL Tuning Advisor to develop SQL profiles for regressed SQL.
To simulate an optimizer upgrade:
On the SQL Performance Analyzer page, click Optimizer Upgrade Simulation.
The Optimizer Upgrade Simulation page appears.
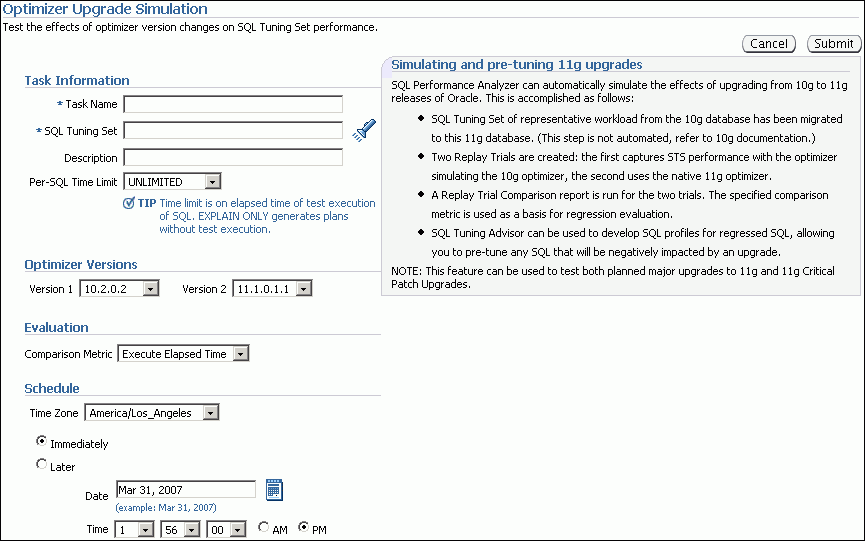
In the Task Name field, enter the name of the task.
For example, enter 111_UPG_OPT_COST.
Select the SQL Tuning Set to use for the comparison. Do one of the following:
In SQL Tuning Set, enter the name the SQL Tuning Set that contains the SQL workload to be analyzed.
Click the search icon to search for a SQL Tuning Set, and then select the set.
The tuning set now appears in the SQL Tuning Set field.
In the Description field, optionally enter a description of the task.
For example enter the following text: This task simulates an upgrade from 10.2.0.2 to 11.1.0.1.
In the Per-SQL Time Limit list, select the time limit for SQL execution during the replay. Do one of the following:
Select UNLIMITED.
The execution will run each of the SQL statements in the SQL Tuning Set to completion and gather performance data. Collecting execution statistics provides greater accuracy in the performance analysis but takes a longer time.
Select EXPLAIN ONLY.
The task will generate execution plans only. This option shortens the execution time, but the performance analysis may not be as accurate.
Select Customize and then enter the specified number of hours, minutes, or seconds.
In the Optimizer Versions section, select the optimizer versions for comparison in the Version 1 and Version 2 lists.
In this example, the optimizer versions 10.2.0.2 and 11.1.0.1 are selected for comparison.
In the Comparison Metric list, select the comparison metric to use for the analysis. Do one of the following:
If you selected EXPLAIN ONLY in Step 5, then select Optimizer Cost.
If you selected UNLIMITED or Customize in Step 5, then select any of the following options:
Elapsed Time
CPU Time
Buffer Gets
Disk Reads
Direct Writes
Optimizer Cost
To perform the comparison analysis by using more than one comparison metric, perform separate comparison analyses by repeating this procedure with different metrics.
In the Schedule section, do one of the following:
Enter your time zone code in the Time Zone field or click the search icon to locate the code for your area.
Select Immediately to start the task now, or Later to schedule the task to start at a time specified with the Date and Time fields.
Click Submit.
A confirmation message appears.
In the SQL Performance Analyzer Tasks table, the status icon of this task changes to an arrow while the execution is in progress. To refresh the status icon, click Refresh. After the task completes, the Status icon changes to a check mark.

In the SQL Performance Analyzer Tasks table, select the optimizer task and click the link in the SQL Performance Analyzer Task column.
The SQL Performance Analyzer Task page appears.
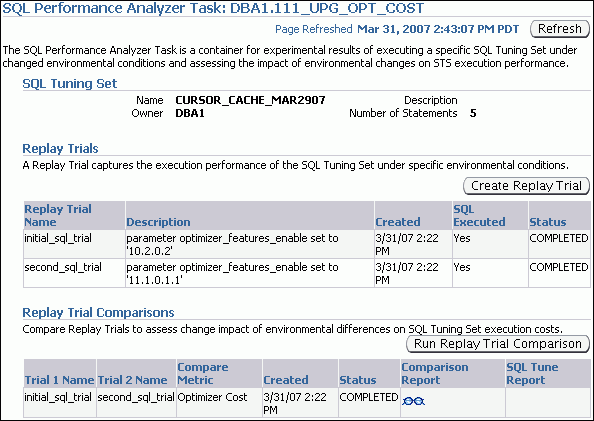
This page contains the following sections:
SQL Tuning Set
This section summarizes information about the tuning set, including the name, owner, description, and number of statements in the set.
Replay Trials
This section includes a table that lists the replay trials used in the SQL Performance Analyzer task.
Replay Trial Comparisons
This section contains a table lists the results of the workload comparisons.
Click the icon in the Comparison Report column.
The SQL Performance Analyzer Task Result page appears.
Review the results of the performance analysis, as described in "Reviewing the SQL Performance Analyzer Report".
See Also:
Oracle Database Reference for more information about the OPTIMIZER_FEATURES_ENABLE initialization parameter
The Parameter Change workflow enables you to test the performance effect on a SQL Tuning Set when you vary a single environment initialization parameter between two values. For example, you can compare SQL performance when the sort area size is increased from 1 MB to 2 MB.
After you select a SQL Tuning Set and a comparison metric, SQL Performance Analyzer creates a task and performs a trial with the initialization parameter set to the original value. The Analyzer then performs a second trial with the parameter set to the new value. The system-generated Replay Trial Comparison report evaluates the regression.
To test an initialization parameter change:
On the SQL Performance Analyzer page, click Parameter Change.
The Parameter Change page appears.
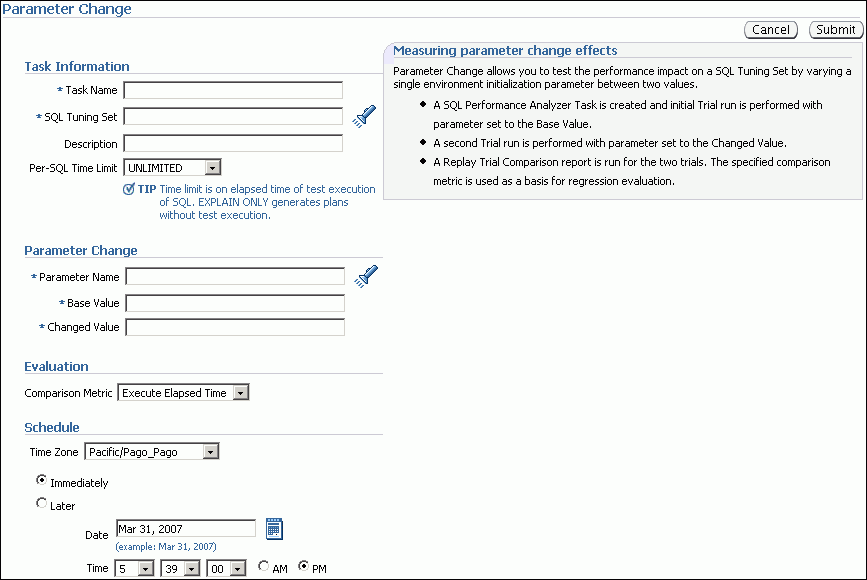
In the Task Name field, enter the name of the task.
For example, enter SORT_TIME.
Select the SQL Tuning Set. Do one of the following:
In SQL Tuning Set, enter the name the SQL Tuning Set that contains the SQL workload to be analyzed.
Click the search icon to search for a SQL Tuning Set, and then select the set.
The tuning set now appears in the SQL Tuning Set field.
In the Description field, optionally enter a description of the task.
For example enter the following text: Double the value of sort_area_size.
In the Per-SQL Time Limit list, determine the time limit for SQL execution during the replay. Do one of the following:
Select UNLIMITED.
The execution will run each of the SQL statements in the SQL Tuning Set to completion and gather performance data. Collecting execution statistics provides greater accuracy in the performance analysis but takes a longer time.
Select EXPLAIN ONLY.
The task will generate execution plans only. This option shortens the execution time, but the performance analysis may not be as accurate.
Select Customize and then enter the specified number of hours, minutes, or seconds.
In the Parameter Change section, complete the following steps:
In the Parameter Name field, enter the name of the initialization parameter whose value you want to modify, or click the Search icon to review the current parameter settings.
For example, enter sort_area_size.
In the Base Value field, enter the current value of the initialization parameter.
For example, enter 1048576.
In the Changed Value field, enter the new value of the initialization parameter.
For example, enter 2097152.
In the Comparison Metric list, select the comparison metric to use for the analysis. Do one of the following:
If you selected EXPLAIN ONLY in Step 5, then select Optimizer Cost.
If you selected UNLIMITED or Customize in Step 5, then select any of the following options:
Elapsed Time
CPU Time
Buffer Gets
Disk Reads
Direct Writes
Optimizer Cost
To perform the comparison analysis by using more than one comparison metric, perform separate comparison analyses by repeating this procedure with different metrics.
In the Schedule section, do one of the following:
Enter your time zone code in the Time Zone field or click the search icon to locate the code for your area.
Select Immediately to start the task now, or Later to schedule the task to start at a time specified with the Date and Time fields.
Click Submit.
A confirmation message appears.
In the SQL Performance Analyzer Tasks table, the status icon of this task changes to an arrow while the execution is in progress. To refresh the status icon, click Refresh. After the task completes, the Status icon changes to a check mark.

In the SQL Performance Analyzer Tasks table, select the optimizer task and click the link in the SQL Performance Analyzer Task column.
The SQL Performance Analyzer Task page appears.
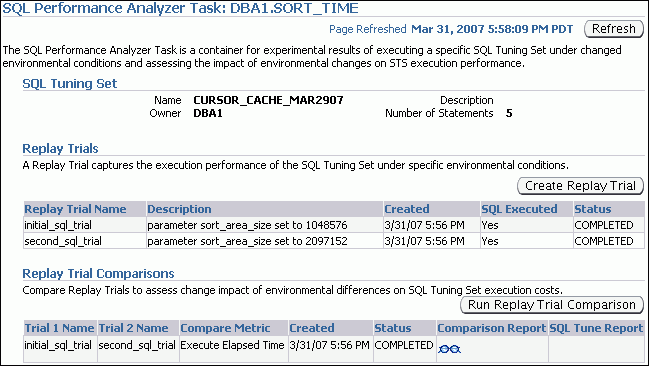
This page contains the following sections:
SQL Tuning Set
This section summarizes information about the tuning set, including the name, owner, description, and number of statements in the set.
Replay Trials
This section includes a table that lists the replay trials used in the SQL Performance Analyzer task.
Replay Trial Comparisons
This section contains a table lists the results of the workload comparisons.
Click the icon in the Comparison Report column.
The SQL Performance Analyzer Task Result page appears.
Review the results of the performance analysis, as described in "Reviewing the SQL Performance Analyzer Report".
You can use the guided workflow to compare the performance of SQL statements before and after a variety of system changes that can impact the performance of the SQL workload.
Tip:
Before you can create a SQL Performance Analyzer task, capture the SQL workload to be used in the performance analysis into a SQL Tuning Set on the production system. Afterward, transport the workload to the test system where the performance analysis will be performed, as described in "Capturing and Transporting a SQL Workload".To initiate a guided workflow:
On the SQL Performance Analyzer page, click Guided Workflow.
The Guided Workflow page appears.
This page lists the required steps in the SQL Performance Analyzer task in sequential order. Each step must be completed in the order displayed before you can begin the next step.
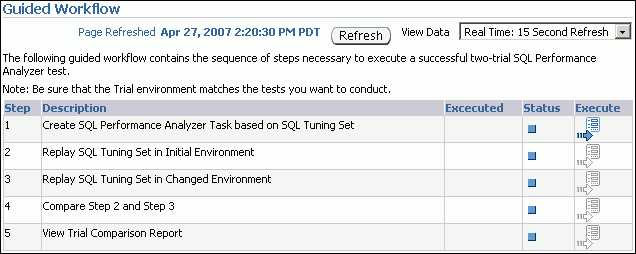
Proceed to the next step, as described in "Creating a SQL Performance Analyzer Task Based on a SQL Tuning Set".
To run SQL Performance Analyzer, you must create a SQL Performance Analyzer task. The task requires you to select the SQL Tuning Set containing the workload to be used in the performance analysis.
The SQL Tuning Set remains constant in the SQL Performance Analyzer task and is executed in isolation during each replay trial. Thus, performance differences between trials are caused by environmental differences.
Tip:
Before you can create a SQL Performance Analyzer task based on a SQL Tuning Set, capture the SQL workload for the performance analysis in a SQL Tuning Set on the production system. Transport the set to the test system, as described in "Capturing and Transporting a SQL Workload".To create a task based on a SQL Tuning Set:
In the Guided Workflow page, click the Execute icon for the Create SQL Performance Analyzer Task based on SQL Tuning Set step.
The Create SQL Performance Analyzer Task page appears.

In the Name field, enter the name of the task.
In the Description field, optionally enter a description of the task.
In the SQL Tuning Set section, do one of the following:
In Name, enter the name the SQL Tuning Set that contains the SQL workload to be analyzed.
Click the search icon to search for a SQL Tuning Set, and then select the set.
The tuning set now appears in the Name field.
Click Create.
The Guided Workflow page appears.
The Status icon of this step has changed to a check mark and the Execute icon for the next step is now enabled.
Proceed to the next step, as described in "Establishing the Initial Environment".
After selecting a SQL Tuning Set as the input source, establish the initial environment on the test system. This step is not included in the Guided Workflow page because you must perform it manually. For more information about setting up the database environment, see "Setting Up the Database Environment on the Test System".
Tip:
Before you establish the initial environment, select a SQL Tuning Set, as described in "Creating a SQL Performance Analyzer Task Based on a SQL Tuning Set".To establish the initial environment:
On the test system, manually make any necessary environmental changes affecting SQL optimization and performance.
These changes could include changing initialization parameters, gathering or setting optimizer statistics, and creating indexes.
Proceed to the next step, as described in "Collecting SQL Performance Data Before the Change".
After you have properly configured the initial environment on the test system, build the pre-change version of performance data by executing the SQL workload before performing the system change. For more information about executing a workload, see "Executing a SQL Workload".
Tip:
Before computing the pre-change version of performance data, establish the initial environment, as described in "Establishing the Initial Environment".To collect SQL performance data before the change:
On the Guided Workflow page, click the Execute icon for the Replay SQL Tuning Set in Initial Environment step.
The Create Replay Trial page appears. A summary of the selected SQL Tuning Set containing the SQL workload is displayed.
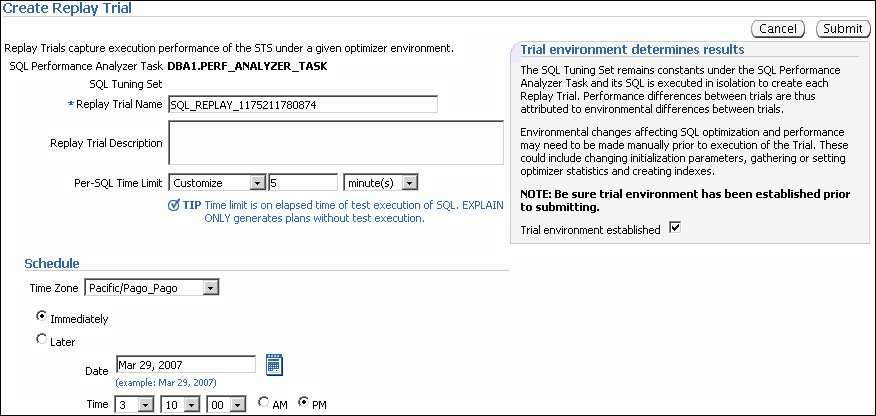
In the Replay Trial Name field, enter the name of the replay trial.
In the Replay Trial Description field, enter a description of the replay trial.
In the Per-SQL Time Limit list, determine the time limit for SQL execution during the replay. Do one of the following:
Select UNLIMITED.
The execution will run each of the SQL statements in the SQL Tuning Set to completion and gather performance data. Collecting execution statistics provides greater accuracy in the performance analysis but takes a longer time.
Select EXPLAIN ONLY.
The task will generate execution plans only. This option shortens the execution time, but the performance analysis may not be as accurate.
Select Customize and then enter the specified number of minutes.
Ensure that the database environment on the test system matches the production environment as closely as possible, and select Trial environment established.
In the Schedule section, do one of the following:
Enter your time zone code in the Time Zone field or click the search icon to locate the code for your area.
Select Immediately to start the task now, or Later to schedule the task to start at a time specified with the Date and Time fields.
Click OK.
The Guided Workflow page appears when the execution begins.
The status icon of this step changes to a clock while the execution is in progress. To refresh the status icon, click Refresh. Depending on the options selected and the size of the SQL workload, the execution may take a long time to complete. After the execution is completed, the Status icon will change to a check mark and the Execute icon for the next step is enabled.
Proceed to the next step, as described in "Making the System Change".
After computing the pre-change SQL performance data, perform the system change on the test system. This step is not included in the Guided Workflow page because you must perform it manually. Depending on the type of change, it may be necessary to reconfigure the environment on the test system to match the new environment for which you want to perform SQL performance analysis, as described in "Setting Up the Database Environment on the Test System".
SQL Performance Analyzer can analyze the SQL performance impact of any type of system change. For example, you may want to test an application upgrade that involves changes such as database table redesign, adding or removing indexes, and so on. For examples of different types of system changes that can be analyzed by SQL Performance Analyzer, see "SQL Performance Analyzer Usage".
Tip:
Before making the system change, build the pre-change version of performance data, as described in "Collecting SQL Performance Data Before the Change".To make the system change:
Make the necessary changes to the test system.
Proceed to the next step, as described in "Collecting SQL Performance Data After the Change".
After you have made the system change, build the post-change version of performance data by executing the SQL workload again. For more information about executing a workload, see "Executing a SQL Workload".
Tip:
Before you can build the post-change version of performance data, make the system change, as described in "Making the System Change".To collect SQL performance after the change:
On the Guided Workflow page, click the Execute icon for the Replay SQL Tuning Set in Changed Environment step.
The Create Replay Trial page appears.
In the Replay Trial Name field, enter the name of the execution.
In the Replay Trial Description field, enter a description of the execution.
In the Per-SQL Time Limit list, determine the time limit for SQL execution during the replay. Do one of the following:
Select UNLIMITED.
The execution will run each of the SQL statements in the selected SQL Tuning Set to completion and gather performance data. Collecting execution statistics provides greater accuracy in the performance analysis but take a longer time to run.
Select EXPLAIN ONLY.
The task will generate execution plans only. This option shortens the execution time but the performance analysis may not be as accurate.
Select Customize and then enter the specified number of minutes.
Ensure that the database environment on the test system is set up to match the production environment as closely as possible, and select Trial environment established.
In the Schedule section, complete the following steps:
Enter your time zone code in the Time Zone field or click the search icon to locate the code for your area.
Select Immediately to start the task now, or Later to schedule the task to start at a time specified using the Date and Time fields.
Click OK.
The Guided Workflow page appears when the execution begins.
The status icon of this step changes to an arrow icon while the execution is in progress. To refresh the status icon, click Refresh. Depending on the options selected and the size of the SQL workload, the execution may take a long time to complete. After the execution is completed, the Status icon will change to a check mark and the Execute icon for the next step is enabled.
Proceed to the next step, as described in "Comparing SQL Performance Before and After the Change".
After the post-change SQL performance data is built, compare the pre-change version of performance data to the post-change version by running a comparison analysis.
Tip:
Before you can compare the pre-change version of performance data with the post-change version, build the post-change version of performance data, as described in "Collecting SQL Performance Data After the Change".To analyze SQL performance before and after the change:
On the Guided Workflow page, click the Execute icon for Compare Step 2 and Step 3.
The Run Replay Trial Comparison page appears.
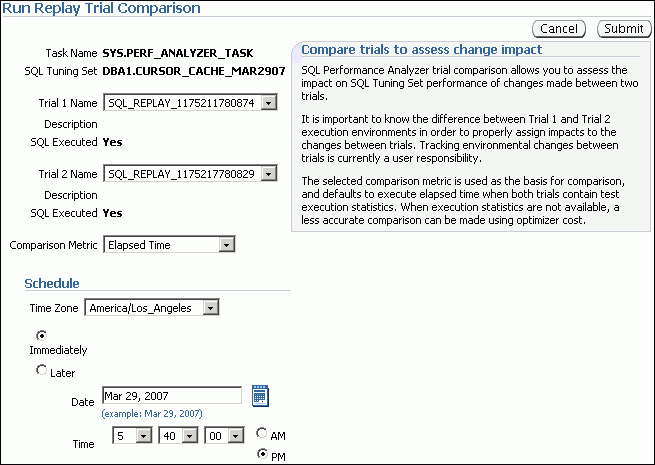
In this example, the SQL_REPLAY_1175211780874 and SQL_REPLAY_1175217780829 trials are selected for comparison.
To compare trials other than those listed by default, select the desired trials in the Trial 1 Name and Trial 2 Name lists.
Note that you cannot compare a statistical trial with a trial that tests the explain plan only.
In the Comparison Metric list, select the comparison metric to use for the comparison analysis.
The types of comparison metrics you can use include:
Elapsed Time
CPU Time
Buffer Gets
Disk Reads
Direct Writes
Optimizer Cost
To perform the comparison analysis by using more than one comparison metric, perform separate comparison analyses by repeating this procedure with different metrics.
In the Schedule section, complete the following steps:
Enter your time zone code in the Time Zone field or click the search icon to locate the code for your area.
Select Immediately to start the task now, or Later to schedule the task to start at a time specified using the Date and Time fields.
Click Submit.
The Guided Workflow page appears when the comparison analysis begins.
The status icon of this step changes to an arrow icon while the comparison analysis is in progress. To refresh the status icon, click Refresh. Depending on the amount of performance data collected from the pre-change and post-change executions, the comparison analysis may take a long time to complete. After the comparison analysis is completed, the Status icon changes to a check mark.
Click the Execute icon for View Trial Comparison Result.
The SQL Performance Analyzer Task Result page appears.
Review the results of the analysis, as described in "Reviewing the SQL Performance Analyzer Report".
When a SQL Performance Analyzer task is completed, the resulting data is generated into a report. This section shows a sample of a SQL Performance Analyzer report. This sample report uses the elapsed time comparison metric to compare the pre-change and post-change executions of a SQL workload.
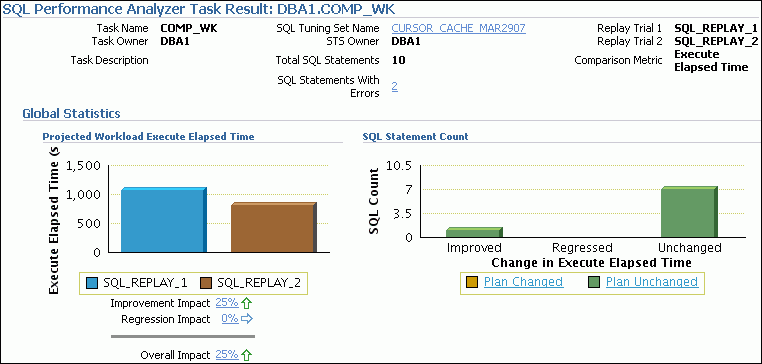
To review the SQL Performance Analyzer report:
Review the general information about the performance analysis, as described in "Reviewing the SQL Performance Analyzer Report: General Information".
Review general statistics, as described in "Reviewing the SQL Performance Analyzer Report: Global Statistics".
Optionally, review the detailed statistics, as described in "Reviewing the SQL Performance Analyzer Report: Global Statistics Details".
The General Information section contains basic information and metadata about the workload comparison performed by SQL Performance Analyzer.

To review general information:
On the SQL Performance Analyzer Task Result page, review the information at the top of the page.
This summary at the top of the page includes the following information:
The name, owner, and description of the SQL Performance Analyzer task
The name and owner of the SQL Tuning Set
The total number of SQL statements in the tuning set and the number of failing statements
The names of the replay trials and the comparison metric used
Optionally, click the link next to SQL Tuning Set Name.
The SQL Tuning Set page appears.
This page contains information the SQL ID, SQL text, and related information about every SQL statement in the set.
Click the link next to SQL Statements With Errors if errors were found.
The SQL Performance Analyzer Task Result page appears.
The Errors table reports all errors that occurred while executing a given SQL workload. An error may be reported at the SQL Tuning Set level if it is common to all statements executions in the SQL Tuning Set, or at the execution level if it is specific to a SQL statement or execution plan.
Review general statistics, as described in "Reviewing the SQL Performance Analyzer Report: Global Statistics".
The Global Statistics section reports statistics that describe the overall performance of the entire SQL workload. This section is a very important part of the SQL Performance Analyzer analysis because it reports on the impact of the system change on the overall performance of the SQL workload. Use the information in this section to understand the tendency of the workload performance, and determine how the workload performance will be affected by the system change.
To review the global statistics:
Review the chart in the Projected Workload Execute Elapsed Time subsection.
The chart shows the two replay executions on the x-axis and the execute elapsed time (in seconds) on the y-axis.
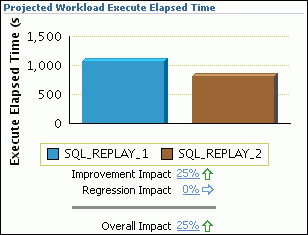
The most important statistic is the overall impact, which is given as a percentage. The overall impact is the difference between the improvement impact and the regression impact. You can click the link for any impact statistic to obtain more details, as described in "Reviewing the SQL Performance Analyzer Report: Global Statistics Details".
In this example, the improvement impact is 25%, while the regression impact is 0%, so the overall impact of the system change is an improvement of 25%.
Review the chart in the SQL Statement Count subsection.
The x-axis of the chart shows the number of SQL statements that are improved, regressed, and unchanged after the system change. The y-axis shows the number of SQL statements. The chart also indicates whether the explain plan was changed or unchanged for the SQL statements.
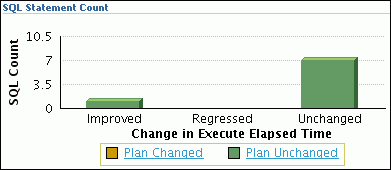
This chart enables you to quickly weigh the relative performance of the SQL statements. You can click any bar in the chart to obtain more details, as described in "Reviewing the SQL Performance Analyzer Report: Global Statistics Details".
In this example, all SQL statements were either improved or unchanged after the system change. Most statements were unchanged.
You can use the SQL Performance Analyzer Report to obtain detailed statistics for the SQL workload comparison. The details chart enables you to drill down into the performance of SQL statements that appears in the Result Summary section of the report. Use the information in this section to investigate why the performance of a particular SQL statement regressed.

To review the global statistics details:
Click the bar in any chart on the SQL Performance Analyzer Task Result page, or click the impact percentages in the Projected Workload Execute Elapsed Time subsection.
A table including the detailed statistics appears. Depending on the table, the following columns are included:
SQL ID
This column indicates the ID of the SQL statement.
Executions
This column indicates the number of times this SQL statement was executed.
Net Impact on Workload (%)
This column indicates the impact of the system change relative to the performance of the SQL workload.
Execute Elapsed Time
This column indicates the total time (in seconds) of the SQL statement execution.
Net Impact on SQL (%)
This column indicates the local impact of the change on the performance of a particular SQL statement.
% of Workload
This column indicates the percentage of the total workload consumed by this SQL statement.
Plan Changed
This column indicates whether the SQL execution plan changed.
Click SQL ID for any SQL statement in the table.
The SQL Details page appears.
You can use this page to access the text of the SQL statement and obtain low-level details such as CPU time, buffer gets, and optimizer cost.