| Oracle® Enterprise Manager Advanced Configuration 10g Release 2 (10.2) Part Number B16242-01 |
|
|
View PDF |
| Oracle® Enterprise Manager Advanced Configuration 10g Release 2 (10.2) Part Number B16242-01 |
|
|
View PDF |
Oracle Enterprise Manager 10g Grid Control is based on a flexible architecture, which allows you to deploy the Grid Control components in the most efficient and practical manner for your organization. This chapter describes some common configurations that demonstrate how you can deploy the Grid Control architecture in various computing environments.
This chapter presents the common configurations in a logical progression, starting with the simplest configuration and ending with a complex configuration that involves the deployment of high availability components, such as server load balancers, Oracle Real Application Clusters, and Oracle Data Guard.
This chapter contains the following sections:
The common configurations described in this chapter are provided as examples only. The actual Grid Control configurations that you deploy in your own environment will vary depending upon the needs of your organization.
For example, the examples in this chapter assume you are using the OracleAS Web Cache port to access the Grid Control Console. By default, when you first install Grid Control, you display the Grid Control Console by navigating to the default OracleAS Web Cache port. In fact, you can modify your own configuration so administrators bypass OracleAS Web Cache and use a port that connects them directly to the Oracle HTTP Server.
For another example, in a production environment you will likely want to implement firewalls and other security considerations. The common configurations described in this chapter are not meant to show how firewalls and security policies should be implemented in your environment.
|
See Also: Chapter 4, "Enterprise Manager Security" for information about securing the connections between Grid Control componentsChapter 5, "Configuring Enterprise Manager for Firewalls" for information about configuring firewalls between Grid Control components |
Besides providing a description of common configurations, this chapter can also help you understand the architecture and flow of data among the Grid Control components. Based on this knowledge, you can make better decisions about how to configure Grid Control for your specific management requirements.
The Grid Control architecture consists of the following software components:
The Oracle Management Agent
The Oracle Management Service
The Oracle Management Repository
The Oracle Enterprise Manager 10g Grid Control Console
|
See Also: Oracle Enterprise Manager Concepts for more information about each of the Grid Control components |
The remaining sections of this chapter describe how you can deploy these components in a variety of combinations and across a single host or multiple hosts.
Figure 3-1 shows how each of the Grid Control components are configured to interact when you install Grid Control on a single host. This is the default configuration that results when you use the Grid Control installation procedure to install the Enterprise Manager 10g Grid Control Using a New Database installation type.
Figure 3-1 Grid Control Components Installed on a Single Host
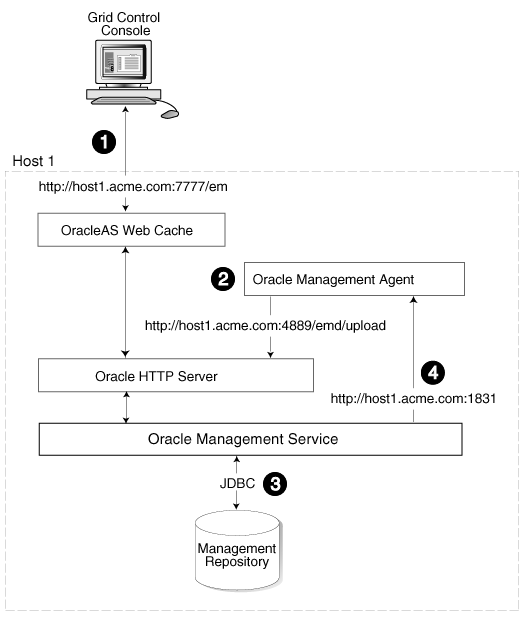
When you install all the Grid Control components on a single host, the management data travels along the following paths:
Administrators use the Grid Control Console to monitor and administer the managed targets that are discovered by the Management Agents on each host. The Grid Control Console uses the default OracleAS Web Cache port (for example, port 7777 on UNIX systems and port 80 on Windows systems) to connect to the Oracle HTTP Server. The Management Service retrieves data from the Management Repository as it is requested by the administrator using the Grid Control Console.
|
See Also: Oracle Application Server Web Cache Administrator's Guide for more information about the benefits of using OracleAS Web Cache |
The Management Agent loads its data (which includes management data about all of the managed targets on the host, including the Management Service and the Management Repository database) by way of the Oracle HTTP Server upload URL. The Management Agent uploads data directly to Oracle HTTP Server and bypasses OracleAS Web Cache. The default port for the upload URL is 4889 (it if is available during the installation procedure). The upload URL is defined by the REPOSITORY_URL property in the following configuration file in the Management Agent home directory:
AGENT_HOME/sysman/config/emd.properties (UNIX)
AGENT_HOME\sysman\config\emd.properties (Windows)
|
See Also: "Understanding the Enterprise Manager Directory Structure" for more information about the AGENT_HOME directory |
The Management Service uses JDBC connections to load data into the repository database and to retrieve information from the repository so it can be displayed in the Grid Control Console. The repository connection information is defined in the following configuration file in the Management Service home directory:
ORACLE_HOME/sysman/config/emoms.properties (UNIX)
ORACLE_HOME\sysman\config\emoms.properties (Windows)
|
See Also: "Reconfiguring the Oracle Management Service" for more information on modifying the repository connection information in the emoms.properties file |
The Management Service sends data to the Management Agent by way of HTTP. The Management Agent software includes a built-in HTTP listener that listens on the Management Agent URL for messages from the Management Service. As a result, the Management Service can bypass the Oracle HTTP Server and communicate directly with the Management Agent. If the Management Agent is on a remote system, no Oracle HTTP Server is required on the Management Agent host.
The Management Service uses the Management Agent URL to monitor the availability of the Management Agent, submit Enterprise Manager jobs, and other management functions.
The Management Agent URL can be identified by the EMD_URL property in the following configuration file in the Management Agent home directory:
AGENT_HOME/sysman/config/emd.properties (UNIX)
AGENT_HOME\sysman\config\emd.properties (Windows)
For example:
EMD_URL=http://host1.acme.com:1831/emd/main/
In addition, by default, the name of the Management Agent as it appears in the Grid Control Console consists of the Management Agent host name and the port used by the Management Agent URL.
Installing all the Grid Control components on a single host is an effective way to initially explore the capabilities and features available to you when you centrally manage your Oracle environment.
A logical progression from the single-host environment is to a more distributed approach, where the Management Repository database is on a separate host and does not compete for resources with the Management Service. Such a configuration is shown in Figure 3-2.
Figure 3-2 Grid Control Components Distributed on Multiple Hosts with One Management Service
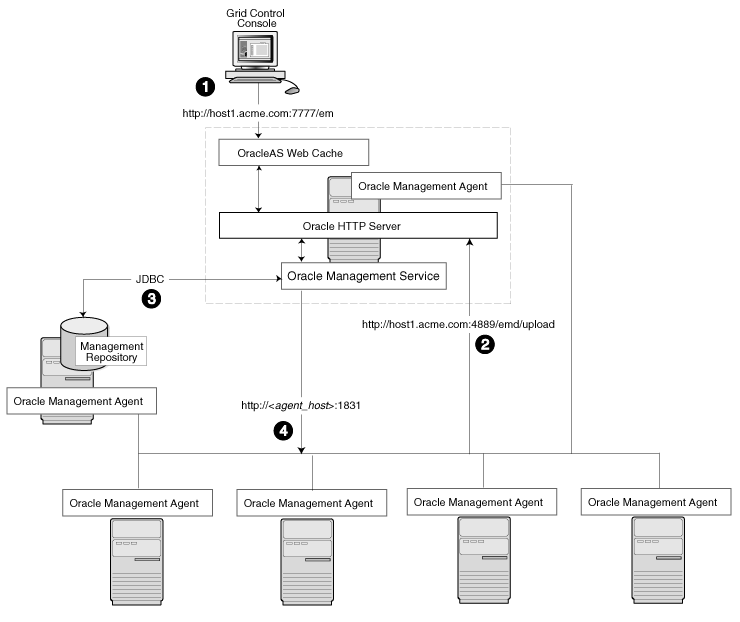
In this more distributed configuration, data about your managed targets travels along the following paths so it can be gathered, stored, and made available to administrators by way of the Grid Control Console:
Administrators use the Grid Control Console to monitor and administer the targets just as they do in the single-host scenario described in Section 3.3.
Management Agents are installed on each host on the network, including the Management Repository host and the Management Service host. The Management Agents upload their data to the Management Service by way of the Management Service upload URL, which is defined in the emd.properties file in each Management Agent home directory. The upload URL bypasses OracleAS Web Cache and uploads the data directly through the Oracle HTTP Server.
The Management Repository is installed on a separate machine that is dedicated to hosting the Management Repository database. The Management Service uses JDBC connections to load data into the repository database and to retrieve information from the repository so it can be displayed in the Grid Control Console. This remote connection is defined in the emoms.properties configuration file in the Management Service home directory.
The Management Service communicates directly with each remote Management Agent over HTTP by way of the Management Agent URL. The Management Agent URL is defined by the EMD_URL property in the emd.properties file of each Management Agent home directory. As described in Section 3.3, the Management Agent includes a built-in HTTP listener so no Oracle HTTP Server is required on the Management Agent host.
In larger production environments, you may find it necessary to add additional Management Service installations to help reduce the load on the Management Service and improve the efficiency of the data flow.
|
Note: When you add additional Management Service installations to your Grid Control configuration, be sure to adjust the parameters of your Management Repository database. For example, you will likely need to increase the number of processes allowed to connect to the database at one time. Although the number of required processes will vary depending on the overall environment and the specific load on the database, as a general guideline, you should increase the number of processes by 40 for each additional Management Service.For more information, see the description of the PROCESSES initialization parameter in the Oracle Database Reference. |
The following sections provide more information about this configuration:
Determining When to Use Multiple Management Service Installations
Understanding the Flow of Management Data When Using Multiple Management Services
Management Services not only exist as the receivers of upload information from Management Agents. They also retrieve data from the Management Repository. The Management Service renders this data in the form of HTML pages, which are requested by and displayed in the client Web browser. In addition, the Management Services perform background processing tasks, such as notification delivery and the dispatch of Enterprise Manager jobs.
As a result, the assignment of Management Agents to Management Services must be carefully managed and balanced. Improper distribution of load from Management Agents to Management Services may result in perceived:
Sluggish user interface response
Delays in delivering notification messages
Backlog in monitoring information being uploaded to the Management Repository
Delays in dispatching jobs
The following sections provide some tips for monitoring the load and response time of your Management Service installations:
Monitoring the Load on Your Management Service Installations
Monitoring the Response Time of the Enterprise Manager Web Application Target
To keep the workload evenly distributed, you should always be aware of how many Management Agents are configured for each Management Service and monitor the load on each Management Service.
At any time, you can view a list of Management Agents and Management Services using the Setup tab of the Grid Control Console.
Use the charts on the Overview page of the Management Services and Repository tab to monitor:
The Loader is part of the Management Service that pushes metric data into the repository at periodic intervals. If the Loader Backlog chart indicates that the backlog is high and Loader output is low, there is data pending load, which may indicate a system bottleneck or the need for another Management Service. The chart shows the total backlog of files totalled over all Oracle Management Services for the past 24 hours. Click the image to display loader backlog charts for each individual Management Service over the past 24 hours.
The Notification Delivery Backlog chart displays the number of notifications to be delivered that could not be processed in the time allocated. Notifications are delivered by the Management Services. This number is summed across all Management Services and is sampled every 10 minutes. The graph displays the data for the last 24 hours. It is useful for determining a growing backlog of notifications. When this graph shows constant growth over the past 24 hours, then you may want to consider adding another Management Service, reducing the number of notification rules, and verifying that all rules and notification methods are useful and valid.
The information on the Management Services and Repository tab can help you determine the load being placed on your Management Service installations. More importantly, you should also consider how the performance of your Management Service installations is affecting the performance of the Grid Control Console.
Use the EM Website Web Application target to review the response time of the Grid Control Console pages:
From the Grid Control Console, click the Targets tab and then click the Web Applications subtab.
In the Key Test Summary table, click homepage. The resulting page provides the response time of the Grid Control Console homepage URL.
Click Page Performance to view the response time of some selected Grid Control Console pages.
|
Note: The Page Performance page provides data generated only by users who access the Grid Control Console by way of the OracleAS Web Cache port (usually, 7777). |
Select 7 Days or 31 Days from the View Data menu to determine whether or not there are any trends in the performance of your Grid Control installation.
Consider adding additional Management Service installations if the response time of all pages is increasing over time or if the response time is unusually high for specific popular pages within the Grid Control Console.
|
Note: You can use Application Performance Management and Web Application targets to monitor your own Web applications. For more information, see Chapter 6, "Configuring Services" |
Figure 3-3 shows a typical environment where an additional Management Service has been added to improve the performance of the Grid Control environment.
Figure 3-3 Grid Control Architecture with Multiple Management Service Installations
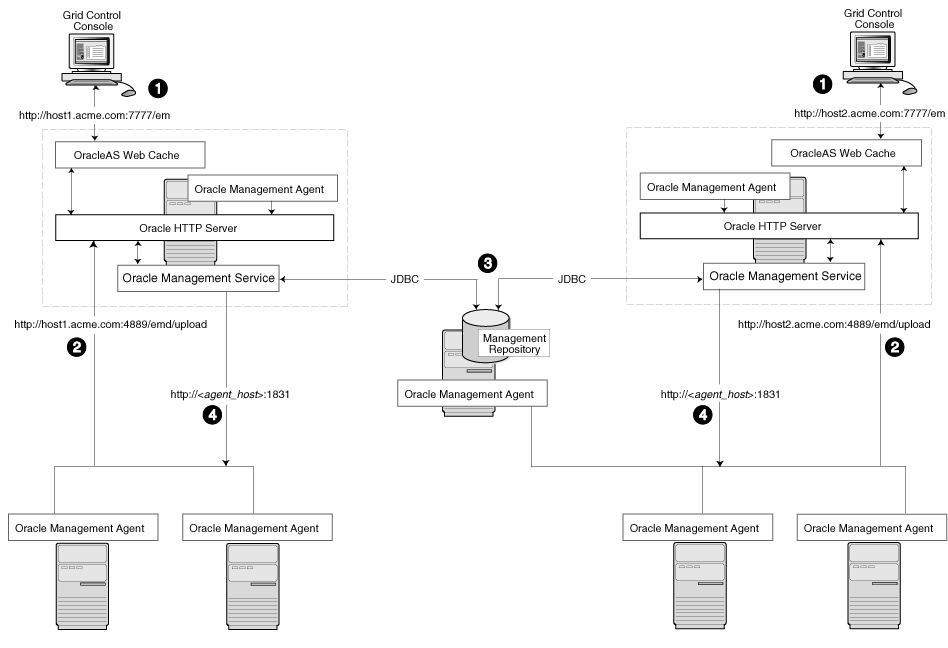
In a multiple Management Service configuration, the management data moves along the following paths:
Administrators can use one of two URLs to access the Grid Control Console. Each URL refers to a different Management Service installation, but displays the same set of targets, all of which are loaded in the common Management Repository. Depending upon the host name and port in the URL, the Grid Control Console obtains data from the Management Service (by way of OracleAS Web Cache and the Oracle HTTP Server) on one of the Management Service hosts.
Each Management Agent uploads its data to a specific Management Service, based on the upload URL in its emd.properties file. That data is uploaded directly to the Management Service by way of Oracle HTTP Server, bypassing OracleAS Web Cache.
Each Management Service communicates by way of JDBC with a common Management Repository, which is installed in a database on a dedicated Management Repository host. Each Management Service uses the same database connection information, defined in the emoms.properties file, to load data from its Management Agents into the Management Repository. The Management Service uses the same connection information to pull data from the Management Repository as it is requested by the Grid Control Console.
Any Management Service in the system can communicate directly with any of the remote Management Agents defined in the common Management Repository. The Management Services communicate with the Management Agents over HTTP by way of the unique Management Agent URL assigned to each Management Agent.
As described in Section 3.3, the Management Agent URL is defined by the EMD_URL property in the emd.properties file of each Management Agent home directory. Each Management Agent includes a built-in HTTP listener so no Oracle HTTP Server is required on the Management Agent host.
When you configure Grid Control for high availability, your aim is to protect each component of the system, as well as the flow of management data in case of performance or availability problems, such as a failure of a host or a Management Service.
One way to protect your Grid Control components is to use high availability software deployment techniques, which usually involve the deployment of hardware server load balancers, Oracle Real Application Clusters, and Oracle Data Guard.
|
Note: The following sections do not provide a comprehensive set of instructions for configuring Grid Control for high availability. The examples here are shown only to provide examples of some common configurations of Grid Control components. These examples are designed to help you understand some of your options when you deploy Grid Control in your environment.For a complete discussion of configuring Oracle products for high availability, refer to Oracle High Availability Architecture and Best Practices |
Refer to the following sections for more information about common Grid Control configurations that take advantage of high availability hardware and software solutions:
Load Balancing Connections Between the Management Agent and the Management Service
Load Balancing Connections Between the Grid Control Console and the Management Service
Before you implement a plan to protect the flow of management data from the Management Agents to the Management Service, you should be aware of some key concepts.
Specifically, you should be aware that Management Agents do not maintain a persistent connection to the Management Service. When a Management Agent needs to upload collected monitoring data or an urgent target state change, the Management Agent establishes a connection to the Management Service. If the connection is not possible, such as in the case of a network failure or a host failure, the Management Agent retains the data and re-attempts to send the information later.
To protect against the situation where a Management Service is unavailable, you can use a server load balancer between the Management Agents and the Management Services.
|
Note: To configure the Management Services for High Availability, you need a storage device that is shared by all the Management Services. The shared storage can be a NFS mounted disk accessible to all Management Services. For achieving a truly high available deployment, a sharable file system like Network Appliance™ Filer is recommended.See "Configuring the Management Services for High Availability" for steps on configuring the Management Services for High Availability. |
However, if you decide to implement such a configuration, be sure to review the following sections carefully before proceeding:
Understanding the Flow of Data When Load Balancing the Upload of Management Data
Configuring a Server Load Balancer for Management Agent Data Upload
The Management Service for Grid Control 10g Release 2 has a new high availability feature called the Shared Filesystem Loader. In the Shared Filesystem Loader, management data files received from Management Agents are stored temporarily on a common shared location called the shared receive directory. All Management Services are configured to use the same storage location for the shared receive directory. The Management Services coordinate internally and distribute amongst themselves the workload of uploading files into the Management Repository. Should a Management Service go down for some reason, its workload is taken up by surviving Management Services.
Configuring the Shared Filesystem Loader
To configure the Management Service to use Shared Filesystem Loader, you must use the emctl config oms loader command.
Stop all the Management Services.
Configure a shared receive directory that is accessible by all Management Services.
Run emctl config oms loader -shared yes -dir <loader directory> individually on all Management Services hosts, where <loader directory> is the full path to the shared receive directory.
Restart all Management Services.
|
Caution: Shared Filesystem Loader mode should be configured on all the Management Services in your Grid Control deployment using the previous steps. Management Services will fail to start if all the Management Services are not configured to run in the same mode. |
Figure 3-4 shows a typical scenario where a set of Management Agents upload their data to a server load balancer, which redirects the data to one of two Management Service installations.
Figure 3-4 Load Balancing Between the Management Agent and the Management Service
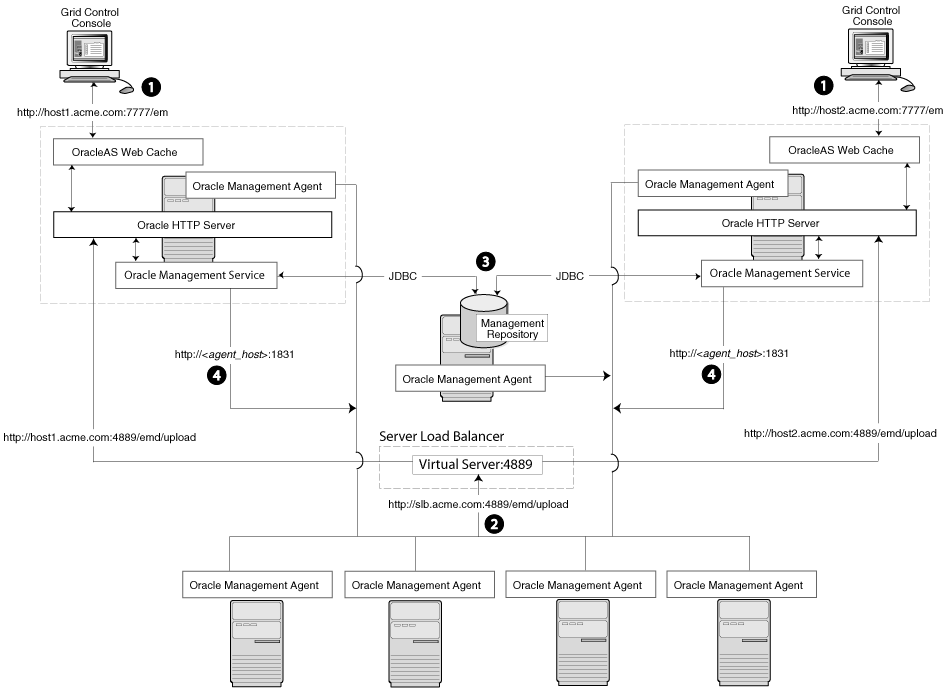
In this example, only the upload of Management Agent data is routed through the server load balancer. The Grid Control Console still connects directly to a single Management Service by way of the unique Management Service upload URL.
When you load balance the upload of Management Agent data to multiple Management Service installations, the data is directed along the following paths:
Administrators can use one of two URLs to access the Grid Control Console just as they do in the multiple Management Service configuration defined in Section 3.5.
Each Management Agent uploads its data to a common server load balancer URL. This URL is defined in the emd.properties file for each Management Agent. In other words, the Management Agents connect to a virtual service exposed by the server load balancer. The server load balancer routes the request to any one of a number of available servers that provide the requested service.
Each Management Service, upon receipt of data, stores it temporarily in a local file and acknowledges receipt to the Management Agent. The Management Services then coordinate amongst themselves and one of them loads the data in a background thread in the correct chronological order.
Each Management Service communicates by way of JDBC with a common Management Repository, just as they do in the multiple Management Service configuration defined in Section 3.5.
Each Management Service communicates directly with each Management Agent by way of HTTP, just as they do in the multiple Management Service configuration defined in Section 3.5.
This section describes some guidelines for configuring a server load balancer to balance the upload of data from Management Agents to multiple Management Service installations.
Specifically, you should use the administration tools that are packaged with your server load balancer to configure a virtual pool that consists of the hosts and the services that each host provides. In the case of the Management Services pool, specify the host name and agent upload port. To insure a highly available Management Service, you should have two or more Management Services defined within the virtual pool.
Modify the REPOSITORY_URL property in the emd.properties file located in the sysman/config directory of the Management Agent home directory. The host name and port specified must be that of the server load balancer virtual service.
|
See Also: "Configuring the Management Agent to Use a New Management Service" for more information about modifying the REPOSITORY_URL property for a Management Agent |
Declare the pool to use a load balancing policy, for example, Round Robin or Least Loaded. Do not configure persistence between Management Agents and Management Services.
This configuration allows the load balancer to distribute connections from Management Agents equally between Management Services. In the event a Management Service becomes unavailable, the load balancer should be configured to direct connections to the surviving Management Services.
To successfully implement this configuration, the load balancer can be configured to monitor the underlying Management Service. On some models, for example, you can configure a monitor on the server load balancer. The monitor defines the:
HTTP request that is to be sent to a Management Service
Expected result in the event of success
Frequency of evaluation
For example, the load balancer can be configured to check the state of the Management Service every 5 seconds. On three successive failures, the load balancer can then mark the component as unavailable and no longer route requests to it. The monitor should be configured to send the string GET /em/upload over HTTP and expect to get the response Http XML File receiver.
|
Note: The network bandwidth requirements on the Server Load Balancer need to be reviewed carefully. Monitor the traffic being handled by the load balancer using the administrative tools packaged with your load balancer. Ensure that the load balancer is capable of handling the traffic passing through it. For example, deployments with a large number of targets can easily exhaust a 100 Mbps Ethernet card. A Gigabit Ethernet card would be required in such cases. |
|
See Also: Your Server Load Balancer documentation for more information on configuring virtual pools, load balancing policies, and monitoring network traffic |
Using a server load balancer to manage the flow of data from the Management Agents is not the only way in which a load balancer can help you configure a highly available Grid Control environment. You can also use a load balancer to balance the load and to provide a failover solution for the Grid Control Console.
The following sections provide more information about this configuration:
Understanding the Flow of Data When Load Balancing the Grid Control Console
Configuring a Server Load Balancer for the Grid Control Console
Configuring Oracle HTTP Server When Using a Server Load Balancer for the Grid Control Console
Figure 3-5 shows a typical configuration where a server load balancer is used between the Management Agents and multiple Management Services, as well as between the Grid Control Console and multiple Management Services.
Figure 3-5 Load Balancing Between the Grid Control Console and the Management Service
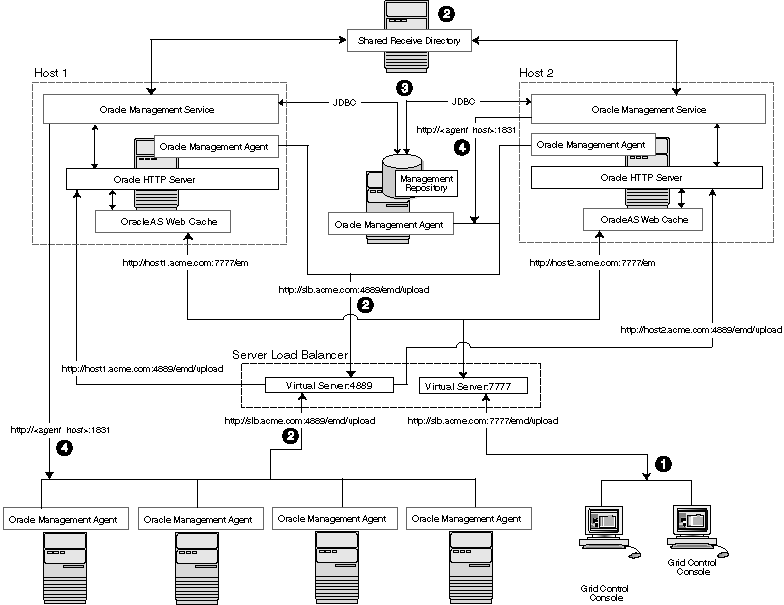
In this example, a single server load balancer is used for the upload of data from the Management Agents and for the connections between the Grid Control Console and the Management Service.
When you use a server load balancer for the Grid Control Console, the management data uses the following paths through the Grid Control architecture:
Administrators use one URL to access the Grid Control Console. This URL directs the browser to the server load balancer virtual service. The virtual service redirects the browser to one of the Management Service installations. Depending upon the host name and port selected by the server load balancer from the virtual pool of Management Service installations, the Grid Control Console obtains the management data by way of OracleAS Web Cache and the Oracle HTTP Server on one of the Management Service hosts.
Each Management Agent uploads its data to a common server load balancer URL (as described in Section 3.6.1) and data is written to the shared receive directory.
Each Management Service communicates by way of JDBC with a common Management Repository, just as they do in the multiple Management Service configuration defined in Section 3.5.
Each Management Service communicates directly with each Management Agent by way of HTTP, just as they do in the multiple Management Service configuration defined in Section 3.5.
Use the administration tools that are packaged with your server load balancer to configure a virtual pool that consists of the hosts and the services that each host provides. In the case of the Management Services pool, specify the host name and default OracleAS Web Cache port. To insure a highly available Management Service, you should have two or more Management Services defined within the virtual pool.
The load balancer parcels the work to any number of Management Service processes that it has in its virtual pool. This provides a method for constant communication to the Grid Control Console in the event of the failure of a Management Service.
The virtual pool for Grid Control Console should to be configured for session persistence. It is necessary that all requests from one user go to the same Management Service for the duration of a session. Use the persistence method provided by your load balancer. For example if you have enabled Enterprise Manager Framework Security and you are running the Management Service in a secure environment (using HTTPS and SSL), use SSL Session ID based persistence. If you have not enabled Enterprise Manager Framework Security and you are running in an environment that is not secure (using HTTP), you could use Client IP or Cookie based persistence.
The Management Service is implemented as a J2EE Web application, which is deployed on an instance of Oracle Application Server. Like many Web-based applications, the Management Service often redirects the client browser to a specific set of HTML pages, such as a logon screen and a specific application component or feature.
When the Oracle HTTP Server redirects a URL, it sends the URL, including the Oracle HTTP Server host name, back to the client browser. The browser then uses that URL, which includes the Oracle HTTP Server host name, to reconnect to the Oracle HTTP Server. As a result, the client browser attempts to connect directly to the Management Service host and bypasses the server load balancer.
To prevent the browser from bypassing the load balancer when a URL is redirected, edit the ServerName directive defined in the Oracle HTTP Server configuration file. This directive will be found in one of two places:
If you have enabled Enterprise Manager Framework Security and you are running the Management Service in a secure environment (using HTTPS and SSL), the ServerName directive you must change is located in the following configuration file:
ORACLE_HOME/Apache/Apache/conf/ssl.conf
If you have not enabled Enterprise Manager Framework Security and you are running in an environment that is not secure (using HTTP), the ServerName directive you must change is located in the following configuration file:
ORACLE_HOME/Apache/Apache/conf/httpd.conf
Change the ServerName directive so it matches the name of the server load balancer virtual service that you configured in Section 3.6.2.2.
When you configure Grid Control for high availability, there are several ways to configure the Management Repository to prevent the loss of management data stored in the database.
The following sections describe a typical configuration designed to safeguard your Management Repository:
Understanding the Flow of Data When Configuring the Management Repository for High Availability
Installing the Management Repository into a Real Applications Clusters (RAC) Database
Specifying the Size of the Management Repository Tablespaces in a RAC Database
Configuring the Management Service to Use Oracle Net Load Balancing and Failover
Figure 3-6 shows a typical Grid Control high availability configuration, where server load balancers are balancing the load on the multiple Management Service installations and the Management Repository is protected by Oracle Real Application Clusters and Oracle Data Guard.
Figure 3-6 Grid Control High Availability Configuration
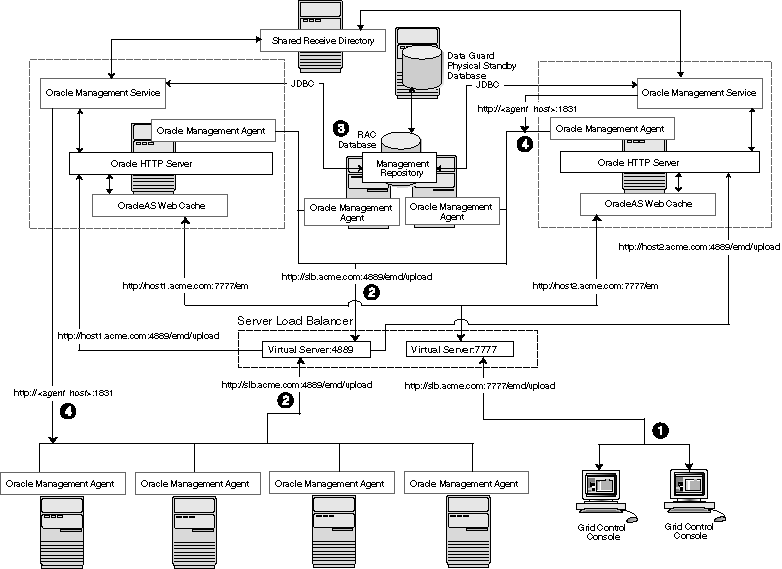
When you install the Management Repository in a RAC database and incorporate Oracle Data Guard into the configuration, the management data uses the following paths through the Grid Control architecture:
Administrators use one URL to access the Grid Control Console. This URL directs the browser to the server load balancer virtual service as described in Section 3.6.2.
Each Management Agent uploads its data to a common server load balancer URL as described in Section 3.6.1.
|
Caution: Before deploying a server load balancer for the upload of Management Agent data, be sure to review Section 3.6.1.3, "Configuring a Server Load Balancer for Management Agent Data Upload" |
Each Management Service communicates by way of JDBC with a common Management Repository, which is installed in a Real Application Clusters instance. Each Management Service uses the same database connection information, defined in the emoms.properties file, to load data into the Management Repository. The Management Service uses the same connection information to pull data from the Management Repository as it is requested by the Grid Control Console.
|
See Also: "Configuring the Management Service to Use Oracle Net Load Balancing and Failover" for information about configuring the connection to a Management Repository that is installed in a RAC database |
In addition, the Management Repository is also protected by Oracle Data Guard. Note that only physical Data Guard is supported for protecting the Management Repository.
Each Management Service communicates directly with each Management Agent by way of HTTP, just as they do in the multiple Management Service configuration defined in Section 3.5.
|
See Also: For information about Maximum Availability Architecture (MAA) refer to Oracle Application Server 10g High Availability Guide |
To install the Management Repository into a RAC database, use the following procedure:
Install the Oracle 10g Database Release 2 (10.2) software and create a RAC database.
Begin installing Grid Control, using the Enterprise Manager 10g Grid Control Using an Existing Database installation option.
When you are prompted for a database system identifier (SID) and port, specify the SERVICE_NAME for one of the RAC instances.
After the Grid Control installation is complete, modify the Management Service connection string to take advantage of client failover in the event of a RAC host outage.
The Management Services rely on repository database listener's connect time load balancing to distribute connections between RAC instances. For the distribution to work optimally in Enterprise Manager Grid Control, ensure that PREFER LEAST LOADED NODE <listener_name> property in listener.ora files is commented out or set to ON.
When you install the Management Repository into a RAC database instance, you cannot set the size of the required Enterprise Manager tablespaces. You can, however, specify the name and location of data files to be used by the Management Repository schema. The default sizes for the initial data file extents depend on using the AUTOEXTEND feature and as such are insufficient for a production installation. This is particularly problematic when storage for the RAC database is on a raw device.
If the RAC database being used for the Management Repository is configured with raw devices, there are two options for increasing the size of the repository.
You can create multiple raw partitions, with the first one equal to the default size of the tablespace as defined by the installation process.
Alternatively, you can create the tablespace using the default size, create a dummy object that will increase the size of the tablespace to the end of the raw partition, then drop that object.
Regardless, if raw devices are used, disable the default space management for these objects, which is to auto-extend.
An alternative for RAC installations is to use ASM managed storage. The location string will have to be specified manually (for example, +DATA/<database_name>/<datafile_name). If ASM storage is used, there is no need to disable any space management storage settings.
When you use a RAC cluster, a standby system, or both to provide high availability for the Management Repository, the Management Service can be configured to use an Oracle Net connect string that will take advantage of redundancy in the repository. Correctly configured, the Management Service process will continue to process data from Management Agents even during a database node outage.
To configure the Management Service to take advantage of this feature:
Use a text editor to open the following configuration file in the Management Service home directory:
ORACLE_HOME/sysman/config/emoms.properties
Locate the following entry in the emoms.properties file:
oracle.sysman.eml.mntr.emdRepConnectDescriptor=
Edit the entry so it includes references to the individual nodes within the RAC database.
The following example shows a connect string that supports a two-node RAC configuration. Note the backslash (\) before each equal sign (=), which is required when you are entering the connect string within the emoms.properties configuration file:
oracle.sysman.eml.mntr.emdRepConnectDescriptor=(DESCRIPTION\=(ADDRESS_
LIST\=(FAILOVER\=ON)(ADDRESS\=(PROTOCOL\=TCP)(HOST\=haem1.us.oracle.com)(PORT\
1521))(ADDRESS\=(PROTOCOL\=TCP)(HOST\=haem2.us.oracle.com)(PORT\=1521)))
(CONNECT_DATA\=(SERVICE_NAME\=em10)))
|
See Also: "Enabling Advanced Features of Oracle Net Services" in the Oracle Database Net Services Administrator's Guide for more information about using the FAILOVER parameter and other advanced features within a database connect string |